. 2009 Dec 29:9:151.
doi: 10.1186/1471-2229-9-151.

Glycosylation-mediated phenylpropanoid partitioning in Populus tremuloides cell cultures

Affiliations

Glycosylation-mediated phenylpropanoid partitioning in Populus tremuloides cell cultures

Raja S Payyavula et al. BMC Plant Biol. .

Abstract

Background: Phenylpropanoid-derived phenolic glycosides (PGs) and condensed tannins (CTs) comprise large, multi-purpose non-structural carbon sinks in Populus. A negative correlation between PG and CT concentrations has been observed in several studies. However, the molecular mechanism underlying the relationship is not known.

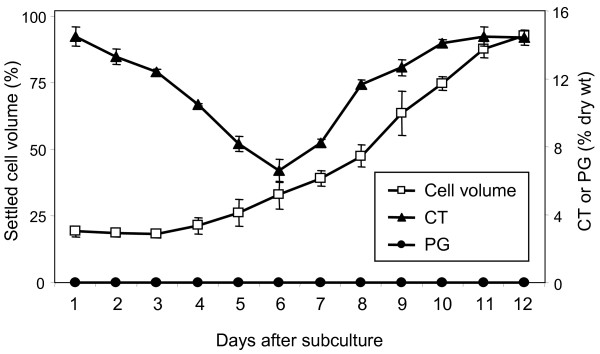
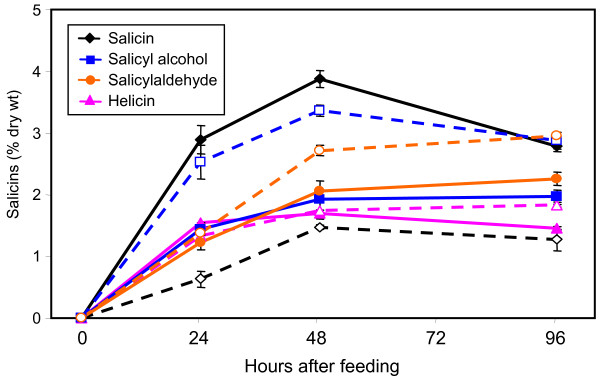
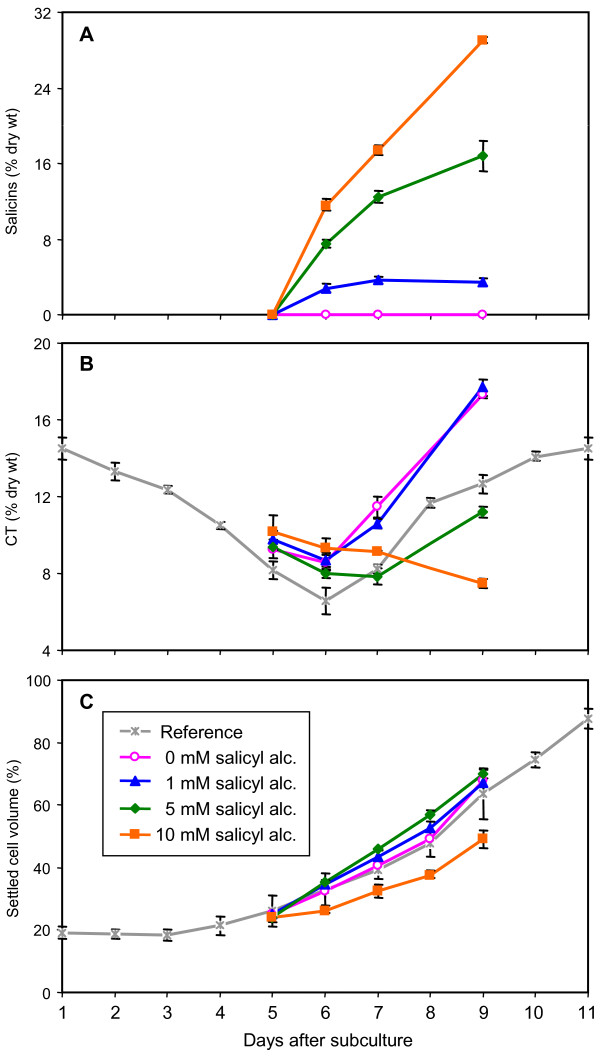
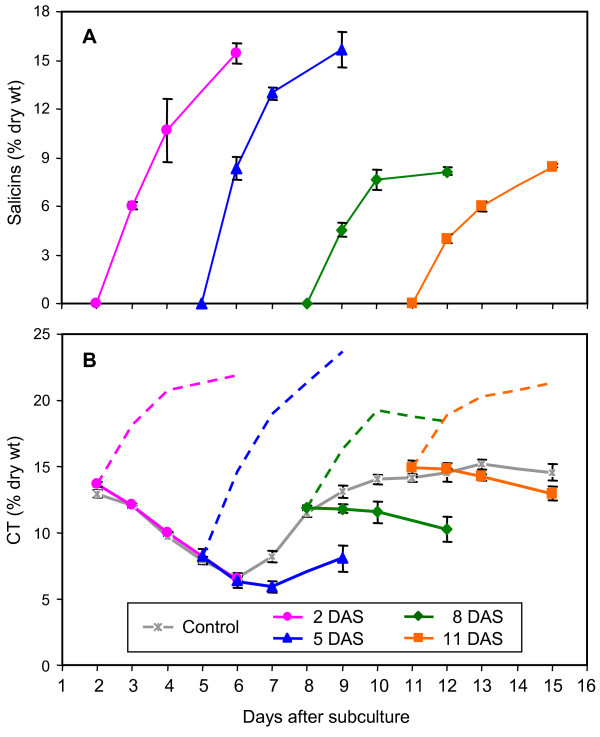
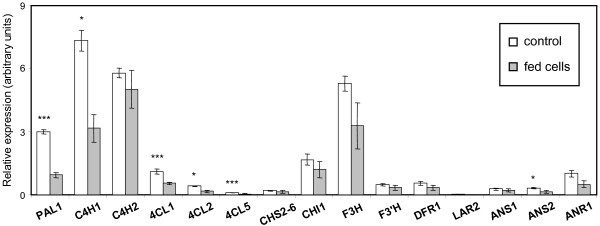
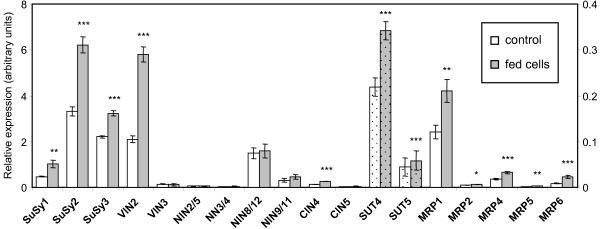
Results: Populus cell cultures produce CTs but not PGs under normal conditions. Feeding salicyl alcohol resulted in accumulation of salicins, the simplest PG, in the cells, but not higher-order PGs. Salicin accrual reflected the stimulation of a glycosylation response which altered a number of metabolic activities. We utilized this suspension cell feeding system as a model for analyzing the possible role of glycosylation in regulating the metabolic competition between PG formation, CT synthesis and growth. Cells accumulated salicins in a dose-dependent manner following salicyl alcohol feeding. Higher feeding levels led to a decrease in cellular CT concentrations (at 5 or 10 mM), and a negative effect on cell growth (at 10 mM). The competition between salicin and CT formation was reciprocal, and depended on the metabolic status of the cells. We analyzed gene expression changes between controls and cells fed with 5 mM salicyl alcohol for 48 hr, a time point when salicin accumulation was near maximum and CT synthesis was reduced, with no effect on growth. Several stress-responsive genes were up-regulated, suggestive of a general stress response in the fed cells. Salicyl alcohol feeding also induced expression of genes associated with sucrose catabolism, glycolysis and the Krebs cycle. Transcript levels of phenylalanine ammonia lyase and most of the flavonoid pathway genes were reduced, consistent with down-regulated CT synthesis.

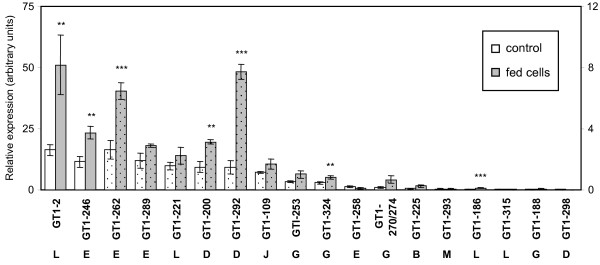
Conclusions: Exogenous salicyl alcohol was readily glycosylated in Populus cell cultures, a process that altered sugar utilization and phenolic partitioning in the cells. Using this system, we identified candidate genes for glycosyltransferases that may mediate the glycosylation, and for transporters that mediate the subcellular compartmentalization of sugars and phenolic glycosides. The suspension cells appear to represent a facile system for dissecting the regulation of phenolic carbon partitioning, and in turn, its effects on growth in Populus.


Figures

Figure 1
Figure 1
Growth and secondary metabolite level in Populus L4 cell suspensions grown under normal culture conditions. Cell growth was estimated as the percent settled cell volume (the fraction of the suspension occupied by the cells, shown on the left axis) using nephelo flasks. CT and PG concentrations (percent dry weight, shown on the right axis) were determined by the Porter assay and HPLC, respectively. Data represents the mean ± SE of three biological replicates.
Figure 2
Figure 2
Levels of salicin and isosalicin accumulation in cultures fed with 1 mM precursors. Solid and dotted lines represent salicin and isosalicin levels, respectively, detected over a 96 h period in cultures fed with salicin, helicin, salicyl alcohol and salicylaldehyde. Error bars represent the measurement range of two biological replicates.
Figure 3
Figure 3
Dose-dependent effects of salicyl alcohol feeding on secondary metabolite accumulation and growth in cell cultures. Salicyl alcohol at 0, 1, 5, or 10 mM was fed to 5-day old cultures and samples were analyzed for (A) total salicins, (B) CTs and (C) growth over a 96 h period. The grey lines in panels B and C are reference data points from separate control samples as presented in Figure 1. Error bars represent the measurement range of two biological replicates.
Figure 4
Figure 4
Effects of culture age on secondary metabolite accumulation following 5 mM salicyl alcohol feeding. Salicyl alcohol at 5 mM was fed to cells 2, 5, 8, or 11 days after subculture (DAS) and samples were analyzed for (A) total salicins, and (B) CTs over a 96 h period. In panel B, the grey line represents CT levels from control (unfed) cultures of this experiment. Dashed color lines represent total phenolics (salicins plus CTs) levels for the corresponding samples. Error bars represent the measurement range of two biological replicates.
Figure 5
Figure 5
Q-PCR expression analysis of phenylpropanoid and flavonoid pathway genes. Relative transcript levels in control and salicyl alcohol-fed cultures are presented as white and gray bars, respectively. Data represents the mean ± SE of three biological replicates. Significance of differences between control and fed cultures was determined using the two-sample t-test, as indicated by asterisks (*P < 0.1; **P < 0.05; ***P < 0.01). Expression of the following genes was near or below detection limit, and was not shown: PAL2, PAL3, PAL4/5, 4CL3, 4CL4, CHS1, F3'5'H, ANR2, LAR1, and LAR3.
Figure 6
Figure 6
Q-PCR expression analysis of sucrose synthase, invertase and selected transporter gene family members. Relative transcript levels in control and salicyl alcohol-fed cultures are presented as white and gray bars, respectively. Data represents the mean ± SE of three biological replicates. Refer to the right-hand side axis for the dotted bars. Significance of differences between control and fed cultures was determined using the two-sample t-test, as indicated by asterisks (*P < 0.1; **P < 0.05; ***P < 0.01). Expression of the following genes was near or below detection limit, and was not shown: SuSy4, SuSy5, SuSy6, VIN1, CIN1/2, CIN3, SUT1/2, SUT3 and MRP3.
Figure 7
Figure 7
Q-PCR expression analysis of GT-1 gene family members. Relative transcript levels in control and salicyl alcohol-fed cultures are presented as white and gray bars, respectively. The arrow at the bottom points to the subgroup of the GTs. Data represents the mean ± SE of three biological replicates. Refer to the right-hand side axis for the dotted bars. Significance of differences between control and fed cultures was determined using the two-sample t-test, as indicated by asterisks (*P < 0.1; **P < 0.05; ***P < 0.01). Expression of the following genes was near or below detection limit, and was not shown: GT1-184, GT1-218, GT1-255.

References

    1. Hwang SY, Lindroth RL. Clonal variation in foliar chemistry of aspen: Effects on gypsy moth and forest tent caterpillar. Oecologia. 1997;111:99–108. doi: 10.1007/s004420050213. - DOI - PubMed
    1. Ruuhola T, Julkunen-Tiitto R. Trade-off between synthesis of salicylates and growth of micropropagated Salix pentandra. Journal of Chemical Ecology. 2003;29:1565–1588. doi: 10.1023/A:1024266612585. - DOI - PubMed
    1. Bryant JP, Reichardt PB, Clausen TP, Werner RA. Effects of mineral nutrition on delayed inducible resistance in Alaska paper birch. Ecology. 1993;74:2072–2084. doi: 10.2307/1940853. - DOI
    1. Donaldson JR, Lindroth RL. Genetics, environment, and their interaction determine efficacy of chemical defense in trembling aspen. Ecology. 2007;88:729–739. doi: 10.1890/06-0064. - DOI - PubMed
    1. Lavola A. Accumulation of flavonoids and related compounds in birch induced by UV-B irradiance. Tree Physiology. 1998;18:53–58. - PubMed

Publication types