. 2010 Jan;137(2):213-21.
doi: 10.1242/dev.044297.

A planarian p53 homolog regulates proliferation and self-renewal in adult stem cell lineages

Affiliations

A planarian p53 homolog regulates proliferation and self-renewal in adult stem cell lineages

Bret J Pearson et al. Development. 2010 Jan.

Abstract

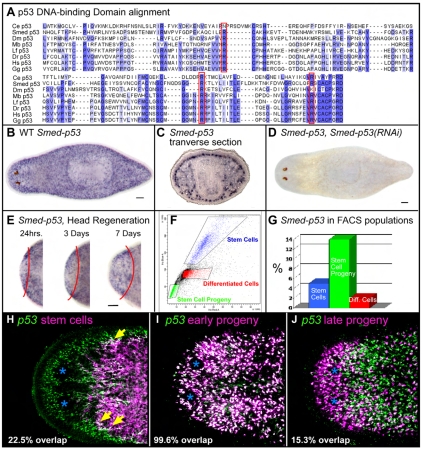
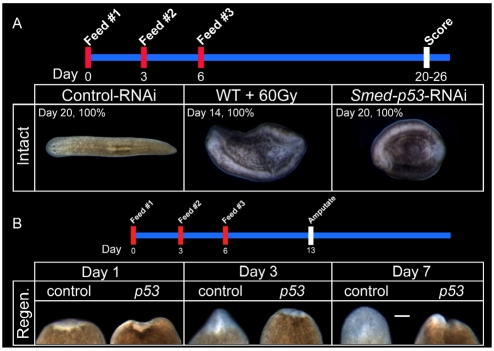
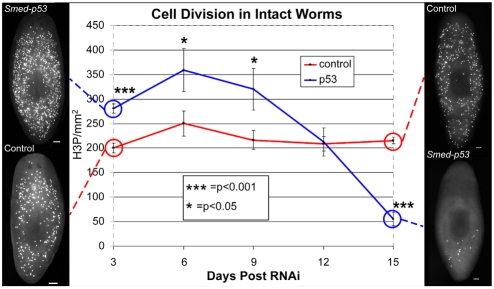
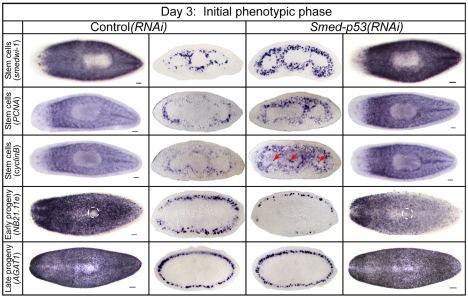
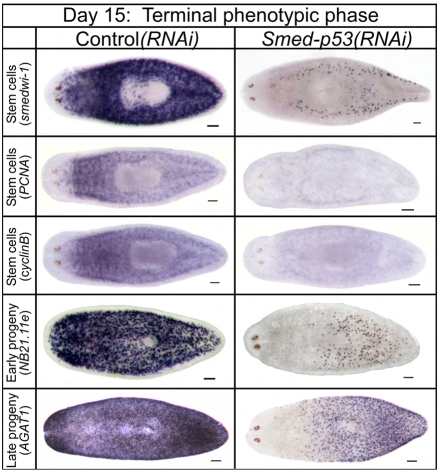
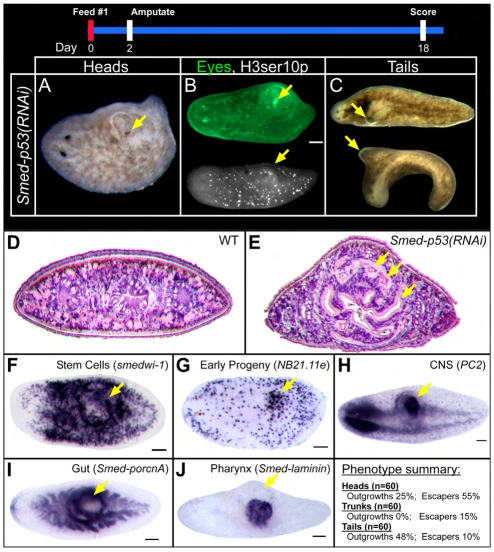
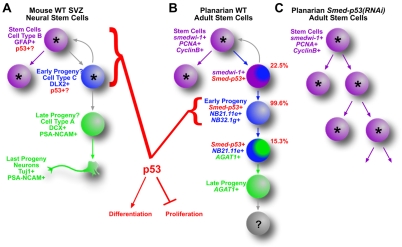
The functions of adult stem cells and tumor suppressor genes are known to intersect. However, when and how tumor suppressors function in the lineages produced by adult stem cells is unknown. With a large population of stem cells that can be manipulated and studied in vivo, the freshwater planarian is an ideal system with which to investigate these questions. Here, we focus on the tumor suppressor p53, homologs of which have no known role in stem cell biology in any invertebrate examined thus far. Planaria have a single p53 family member, Smed-p53, which is predominantly expressed in newly made stem cell progeny. When Smed-p53 is targeted by RNAi, the stem cell population increases at the expense of progeny, resulting in hyper-proliferation. However, ultimately the stem cell population fails to self-renew. Our results suggest that prior to the vertebrates, an ancestral p53-like molecule already had functions in stem cell proliferation control and self-renewal.


Figures

Fig. 1.
Fig. 1.
Sequence and expression pattern of Smed-p53. (A) Alignment of the DNA-binding domain of several p53 family members, with homologous residues shaded in blue. The three most commonly mutated residues in P53 in human cancers are framed in red. (B) Whole-mount in situ hybridization (WISH) for Smed-p53. All whole-mount staining patterns show dorsal views with anterior to the left. (C) WISH for Smed-p53, showing transverse section of worm at the axial level of the pharynx, dorsal is up. (D) WISH for Smed-p53 in a Smed-p53(RNAi) worm, 12 days after RNAi feedings. (E) WISH for Smed-p53 in an amputated worm growing a new head. Red line indicates amputation plane, new tissue (head) is to the left. (F) FACS profile of a dissociated wild-type planarian. Blue indicates the window enriched for stem cells, green indicates the window enriched for stem cell progeny, and red indicates differentiated cell types. (G) FACS-purified cell populations from F showing the relative percentage of cells in each population that express Smed-p53. (H-J) Double fluorescent WISH (FISH) for Smed-p53 and stem cells (H, smedwi-1), early progeny (I, Smed-NB21.11e), or late progeny (J, Smed-AGAT1). Blue asterisks indicate the position of the photoreceptors. Yellow arrows show double-positive cells. In this color scheme, double-positive cells appear white. For sequences used in alignment: Ce, C. elegans; Dm, Drosophila; Dr, zebrafish; Gg, chicken; Hs, human; Lf, squid; Mb, choanoflagellate; Smed, planaria. Scale bars: 100 μm.
Fig. 2.
Fig. 2.
Smed-p53(RNAi) causes tissue homeostasis and regeneration defects. (A) Intact phenotype of Smed-p53(RNAi). The timeline for the experiment is shown across the top. First panel shows a dorsal view of a Control(RNAi) worm. Second panel shows a ventral view of a wild-type worm, 14 days after 60 Gy of irradiation, and the characteristic ventral curling phenotype which occurs when stem cells are lost. The third panel shows a ventral view of a Smed-p53(RNAi) worm 20 days post-RNAi feeding, which is consistent with a stem cell-defective phenotype. (B) The timeline for the experiment is shown across the top. Each panel shows a dorsal view of tail fragments regenerating a new head, with anterior up. Newly made tissue is relatively unpigmented. Worms are amputated 7 days after RNAi feeding, and their regeneration followed for the proceeding 7 days. As compared with Control(RNAi) worms, Smed-p53(RNAi) regeneration is severely deficient, indicating that Smed-p53 is required for proper stem cell function. Scale bars: 100 μm.
Fig. 3.
Fig. 3.
Analysis of cell division during the course of the Smed-p53(RNAi) phenotype. Animals were stained following RNAi feeding, every 3 days for 15 days, using the marker H3ser10p, which marks cells during the G2/M transition of the cell cycle. Dorsal views with anterior to the top. Note the hyper-proliferation in Smed-p53(RNAi) worms during the first 9 days (blue line). Representative animals depicting this time point are shown on the left. Also note the loss of cell division at the latest time point of the Smed-p53(RNAi) phenotype. Representative animals depicting this time point are shown at the right. Statistical differences are measured by Student's t-test and error bars indicate s.e.m. For each time point, n>20 with at least four experimental replicates. Scale bars: 100 μm.
Fig. 4.
Fig. 4.
Analysis of stem cells and progeny during the initial phase (day 3) of the Smed-p53(RNAi) phenotype. Whole-mount animals (the two outside columns) are shown dorsal side up with anterior to the left, with the exception of NB21.11e which are ventral side up and with the ventral opening to the digestive system circled (white dashed line). Cross-sections (the central two columns) for individual markers are shown with ventral side towards the bottom and at the same axial level to facilitate comparison across genotypes. At this time point, stem cell markers are increased, early progeny decreased, and late progeny unaffected. Red arrows indicate ectopic expression in gut branches, which was never observed in control animals. Scale bars: 100 μm.
Fig. 5.
Fig. 5.
Analysis of stem cell lineage during the late phase (day 15) of the Smed-p53(RNAi) phenotype. Staining for the indicated cell lineage markers; dorsal views with anterior to the left. By day 15, when proliferation is observed to be depleted, stem cells, early progeny and late progeny are also depleted. Because the wild type has a higher cell turnover in the anterior-most cells (Eisenhoffer et al., 2008), we also observe corresponding anterior depletion when the stem cell lineage collapses. In most cases at this time point, staining for these markers in Smed-p53(RNAi) animals is undetectable. Scale bars: 100 μm.
Fig. 6.
Fig. 6.
Smed-p53(RNAi) hypomorphic phenotypes. When planarians were fed lower levels of RNAi, head and tail (but not trunk) fragments developed a characteristic dorsal outgrowth directly above where a new pharynx is forming (see phenotype summary). (A) A head fragment is shown with a dorsal outgrowth that contains an ectopic eye (arrow). (B) The ectopic eye was also recognized as such by the eye-specific antibody VC-1 (green) and cell division was also seen in outgrowths by H3ser10p immunostaining. (C) The tail fragment above is a dorsal view, whereas that below is a lateral view with dorsal up. (D,E) Hematoxylin and Eosin staining of transverse sections through the outgrowth showed dramatic disorganization compared with the wild type, particularly of the gut (arrows indicate ectopic gut branches). (F-J) Views are dorsolateral. In situ analysis confirmed that the outgrowth region contains (F) stem cells, (G) early progeny, (H) nervous tissue, (I) gut and (J) pharyngeal tissue. Arrows indicate outgrowth regions or ectopic tissue types. Scale bars: 100 μm.
Fig. 7.
Fig. 7.
Model of p53 function in mouse neural stem cell and planarian stem cell lineages. The known and unknown lineage relationships for mouse sub-ventricular zone (SVZ) neural stem cells and planarian adult stem cells. In mouse (A), precisely which cell types express p53 are unknown, although p53 functions somewhere near the top of the stem cell lineage to suppress proliferation and, most likely, to promote differentiation. In planarians (B), the lineage relationships of the cell types are known. Smed-p53 is expressed in all three cell types, also near the top of the stem cell lineage, but is primarily expressed in the early progeny. The data presented here show that this cell type is the first to be affected when Smed-p53 is lost, and that these cells lose their normal marker expression while at the same time a hyper-proliferation is observed, resulting in lineage model (C). Our data suggest that SMED-P53 has a tumor suppressor-like function in the early progeny, and in effect promotes the transition from a newly born daughter cell. In both systems, progeny feedback models (gray curved arrows) cannot be ruled out. Other gray arrows indicate inconclusive lineage relationships.

Similar articles

Cited by

References

    1. Alfarano C., Andrade C. E., Anthony K., Bahroos N., Bajec M., Bantoft K., Betel D., Bobechko B., Boutilier K., Burgess E., et al. (2005). The Biomolecular Interaction Network Database and related tools 2005 update. Nucleic Acids Res. 33, D418-D424 - PMC - PubMed
    1. Brodsky M. H., Nordstrom W., Tsang G., Kwan E., Rubin G. M., Abrams J. M. (2000). Drosophila p53 binds a damage response element at the reaper locus. Cell 101, 103-113 - PubMed
    1. Cantarel B. L., Korf I., Robb S. M., Parra G., Ross E., Moore B., Holt C., Sánchez Alvarado A., Yandell M. (2008). MAKER: an easy-to-use annotation pipeline designed for emerging model organism genomes. Genome Res. 18, 188-196 - PMC - PubMed
    1. Chudnovsky Y., Adams A. E., Robbins P. B., Lin Q., Khavari P. A. (2005). Use of human tissue to assess the oncogenic activity of melanoma-associated mutations. Nat. Genet. 37, 745-749 - PMC - PubMed
    1. Derry W. B., Putzke A. P., Rothman J. H. (2001). Caenorhabditis elegans p53: role in apoptosis, meiosis, and stress resistance. Science 294, 591-595 - PubMed

Publication types

Substances