. 2010 May;24(5):1376-90.
doi: 10.1096/fj.09-146308. Epub 2009 Dec 29.

Increased superoxide in vivo accelerates age-associated muscle atrophy through mitochondrial dysfunction and neuromuscular junction degeneration

Affiliations

Increased superoxide in vivo accelerates age-associated muscle atrophy through mitochondrial dysfunction and neuromuscular junction degeneration

Youngmok C Jang et al. FASEB J. 2010 May.

Abstract

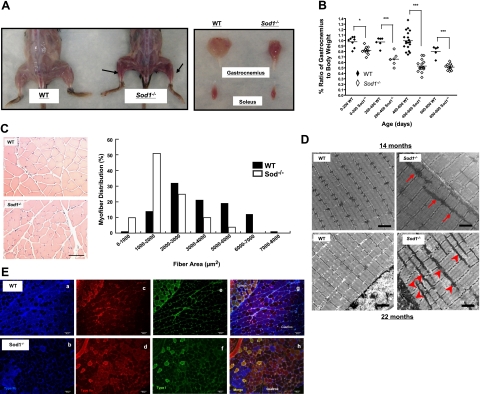
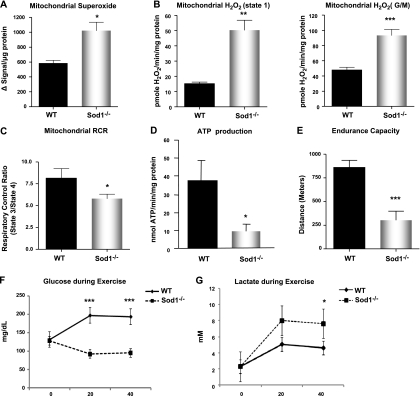
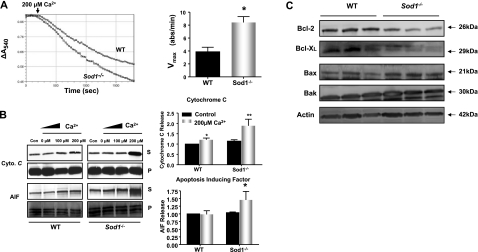
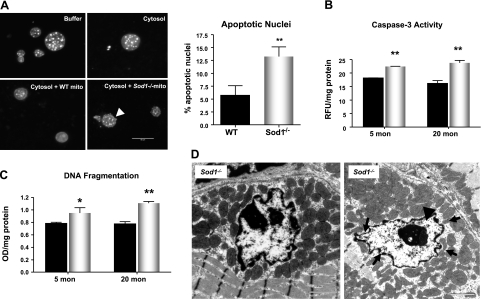
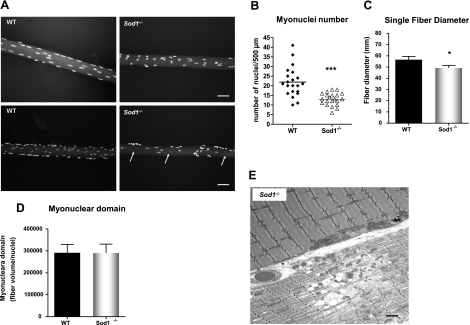
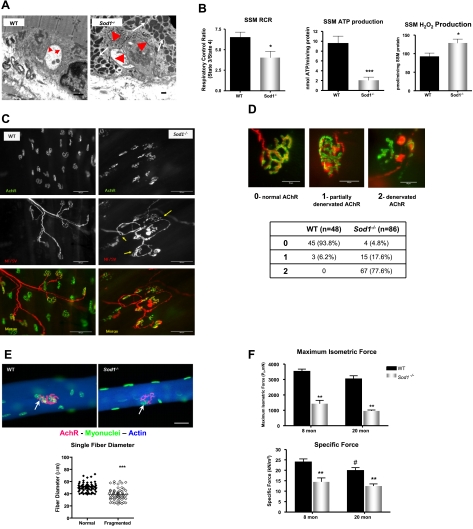
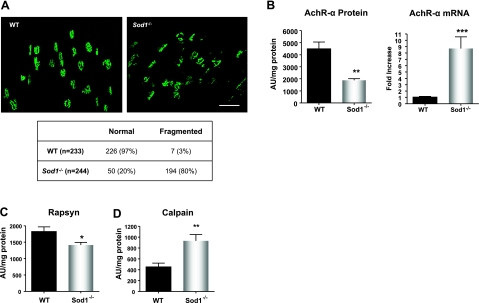
Oxidative stress has been implicated in the etiology of age-related muscle loss (sarcopenia). However, the underlying mechanisms by which oxidative stress contributes to sarcopenia have not been thoroughly investigated. To directly examine the role of chronic oxidative stress in vivo, we used a mouse model that lacks the antioxidant enzyme CuZnSOD (Sod1). Sod1(-/-) mice are characterized by high levels of oxidative damage and an acceleration of sarcopenia. In the present study, we demonstrate that muscle atrophy in Sod1(-/-) mice is accompanied by a progressive decline in mitochondrial bioenergetic function and an elevation of mitochondrial generation of reactive oxygen species. In addition, Sod1(-/-) muscle exhibits a more rapid induction of mitochondrial-mediated apoptosis and loss of myonuclei. Furthermore, aged Sod1(-/-) mice show a striking increase in muscle mitochondrial content near the neuromuscular junctions (NMJs). Despite the increase in content, the function of mitochondria is significantly impaired, with increased denervated NMJs and fragmentation of acetylcholine receptors. As a consequence, contractile force in aged Sod1(-/-) muscles is greatly diminished. Collectively, we show that Sod1(-/-) mice display characteristics of normal aging muscle in an accelerated manner and propose that the superoxide-induced NMJ degeneration and mitochondrial dysfunction are potential mechanisms of sarcopenia.


Figures

Figure 1.
Figure 1.
Age-dependent loss of muscle mass corresponds to increased mitochondria content and oxidative fibers in Sod1−/− mice. A) Left panel: gross morphology of skinned hindlimb muscles of 20-mo-old Sod1−/− and WT mice. Right panel: comparison of individual muscles. B) Comparison of age-associated changes in wet weight of gastrocnemius mass normalized to body weight. C) Top panels: gastrocnemius cross section at 20 mo of age from hematoxylin and eosin stain. Bottom panel: frequency distribution of fiber cross-sectional area (μm2) of gastrocnemius muscle in WT and Sod1−/− at 20 mo (n=4). D) EM images of gastrocnemius at 14 mo (top panels) and at 22 mo (bottom panels). Arrows and arrowheads indicate increased mitochondria. E) Immunofluorescence images of muscle fiber types from WT (a, c, e, g) and Sod1−/− (b, d, f, h) gastrocnemius muscle at 20 mo. a, b) Type IIb (blue). c, d) Type IIa (red). e, f) Type I (green). g, h) Merged images. Scale bars = 50 μm (C); 2 μm (D); 100 μm (E).
Figure 2.
Figure 2.
Mitochondrial dysfunction and increased ROS generation in aged Sod1−/− mice. A) Extramitochondrial superoxide generation in isolated mitochondria, measured using EPR. Succinate was used as substrate. B) Rate of mitochondrial H2O2 production measured using amplex red in state 1 (left panel) and in response to complex I-linked substrate, glutamate, and malate (right panel). C) Mitochondrial oxygen consumption, expressed as RCR. D) Rate of ATP generation in isolated mitochondria at 20 mo (n=6). E) Treadmill endurance test (run to exhaustion) results from 12- to 14-mo-old WT and Sod1−/− mice. (n=8–10) F, G) Plasma glucose (F) and plasma lactate (G) levels measured immediately following exercise. Values are means ± se. *P < 0.05; **P < 0.01; ***P < 0.001.
Figure 3.
Figure 3.
Elevation of mitochondrial-mediated apoptosis in aged Sod1−/− mice. A) Left panel: induction of mitochondrial permeability transition pore (MPTP) opening, measured by a decrease in light absorbance at 540 nm. WT and Sod1−/− muscle mitochondria were treated with 200 μM Ca2+. Right panel: quantification of Vmax from the MPTP experiment (n=6). B) Left panels: Ca2+-induced cytochrome c and AIF release, measured by Western blot analyses. S, supernatant (released from mitochondria); P, pellet (intact). Right panels: quantification of cytochrome c (top) and AIF release (bottom) in supernatant (n=6). Fold change normalized to WT control value. C) Up-regulation of proapoptotic proteins, Bak and Bax, and down-regulation of antiapoptotic proteins, Bcl-2 and Bcl-XL, measured by Western blot analyses. Actin was used as a loading control for each protein; one representative blot is shown.
Figure 4.
Figure 4.
Elevation of caspase-3 activity and apoptosis in aged Sod1−/− mice. A) Left panels: cell-free apoptosis, measured by liver nuclei treated with buffer alone (top left), WT muscle cytosolic fraction alone (top right), WT mitochondria and WT cytosol (bottom left), and Sod1−/− mitochondria and Sod1−/− cytosol (bottom right). Arrowhead indicates nuclear blebbing. Right panel: quantification of apoptotic nuclei, measured 4 h after incubation. Assay was run in duplicates and repeated with mitochondria isolated from different animals (n=4). B) Caspase-3 activity, measured by cleavage of synthetic peptide N-acetyl-DEVD-AMC (n=6). C) Apoptosis, determined by quantification of DNA fragmentation (mononucleosome and oligonucleosome) (n=6). Values are means ± se. *P < 0.05; **P < 0.01. D) EM images of myonuclei undergoing apoptotic changes. Arrows indicate nuclear membrane invagination; arrowhead indicates chromatin condensation. Scale bars = 2 μm.
Figure 5.
Figure 5.
Aged Sod1−/− mice exhibit decreases in myonuclei number and fiber diameter. A) Single-fiber size comparison of WT and Sod1−/− gastrocnemius muscle at 20 mo. Arrows indicate areas lacking myonuclei. B) Quantification of myonuclei per 500 μm in both WT and Sod1−/− gastrocnemius muscle at 20 mo. C) Quantification of average fiber diameter across single fibers in gastrocnemius muscle from WT and Sod1−/− mice at 20 mo. D) Quantification of myonuclear domain, measured by fiber volume per myonuclei number. E) EM of fibers showing dystrophic/necrotic fiber in Sod1−/− muscle at 20 mo. Black arrows indicate abnormal mitochondria; arrowheads indicate lipid vacuoles. Scale bars = 50 μm (A); 2 μm (E). Values are means ± se. *P < 0.05; ***P < 0.001.
Figure 6.
Figure 6.
Aged Sod1−/− mice exhibit alterations in NMJs and increased denervation. A) EM analysis of NMJ of gastrocnemius at 20 mo. Arrows in WT and arrowheads in Sod1−/− indicate synaptic cleft. B) SSM function. Left panel: RCR, measured from SSM from hindlimb muscle at 20 mo. Middle panel: ATP production from SSM, measured at 20 mo. Right panel: rate of H2O2 production from SSM at 20 mo. C) NMJ immunofluorescence images from gastrocnemius at 20 mo. Top panels: morphology of postsynaptic AChRs stained with Alexa 488-conjugated α-bungarotoxin. Middle panels: morphology of presynaptic motor neurons in Thy1 YFP transgenic mice (C57BL/6J background) crossbred to WT and Sod1−/− mice. Arrows indicate sprouting and thinning of motor neurons. Bottom panels: overlay images of AChR and motor neuron images shown in top panels. D) Rate of denervation score assessment (top panels) and quantification of denervation score at ∼18 mo (bottom panel). E) Comparison of NMJs in single fibers (top panels) and correlation of fiber diameter and NMJ fragmentation (bottom panel). Arrows indicate NMJs in WT and Sod1−/− fibers. F) In situ isometric contraction properties. Maximum isometric force (top) and specific force (bottom). Values are means ± se. *P < 0.05; #P < 0.05; **P < 0.01; ***P < 0.001. Scale bars = 2 μm (A); 50 μm (D)
Figure 7.
Figure 7.
Disruption of neuromuscular junction proteins in aged Sod1−/− mice. A) Top panels: comparison of z-stacked images of Alexa 488-conjugated α-bungarotoxin-stained AChR. Bottom panel: quantification of fragmented AChR at 18 mo. Scale bar = 50 μm. B) AChR-mRNA transcript (right panel) and protein expression (left panel) at 18–20 mo. C) Rapsyn protein expression at 20 mo. D) Calpain protein levels at 18–20 mo. Values are means ± se. *P < 0.05; **P < 0.01; ***P < 0.001.

Similar articles

Cited by

References

    1. Mansouri A, Muller F L, Liu Y, Ng R, Faulkner J, Hamilton M, Richardson A, Huang T T, Epstein C J, Van Remmen H. Alterations in mitochondrial function, hydrogen peroxide release and oxidative damage in mouse hind-limb skeletal muscle during aging. Mech Ageing Dev. 2006;127:298–306. - PubMed
    1. Moylan J S, Reid M B. Oxidative stress, chronic disease, and muscle wasting. Muscle Nerve. 2007;35:411–429. - PubMed
    1. Choksi K B, Nuss J E, Deford J H, Papaconstantinou J. Age-related alterations in oxidatively damaged proteins of mouse skeletal muscle mitochondrial electron transport chain complexes. Free Radic Biol Med. 2008;45:826–838. - PMC - PubMed
    1. Figueiredo P A, Powers S K, Ferreira R M, Appell H J, Duarte J A. Aging impairs skeletal muscle mitochondrial bioenergetic function. J Gerontol A Biol Sci Med Sci. 2009;64:21–33. - PMC - PubMed
    1. Lexell J, Taylor C C, Sjostrom M. What is the cause of the ageing atrophy? Total number, size and proportion of different fiber types studied in whole vastus lateralis muscle from 15- to 83-year-old men. J Neurol Sci. 1988;84:275–294. - PubMed

Publication types

MeSH terms