. 2009 Dec;21(12):3937-49.
doi: 10.1105/tpc.109.072249. Epub 2009 Dec 29.

Movement and remodeling of the endoplasmic reticulum in nondividing cells of tobacco leaves

Affiliations

Movement and remodeling of the endoplasmic reticulum in nondividing cells of tobacco leaves

I Sparkes et al. Plant Cell. 2009 Dec.

Abstract

Using a novel analytical tool, this study investigates the relative roles of actin, microtubules, myosin, and Golgi bodies on form and movement of the endoplasmic reticulum (ER) in tobacco (Nicotiana tabacum) leaf epidermal cells. Expression of a subset of truncated class XI myosins, which interfere with the activity of native class XI myosins, and drug-induced actin depolymerization produce a more persistent network of ER tubules and larger persistent cisternae. The treatments differentially affect two persistent size classes of cortical ER cisternae, those >0.3 microm(2) and those smaller, called punctae. The punctae are not Golgi, and ER remodeling occurs in the absence of Golgi bodies. The treatments diminish the mobile fraction of ER membrane proteins but not the diffusive flow of mobile membrane proteins. The results support a model whereby ER network remodeling is coupled to the directionality but not the magnitude of membrane surface flow, and the punctae are network nodes that act as foci of actin polymerization, regulating network remodeling through exploratory tubule growth and myosin-mediated shrinkage.


Figures
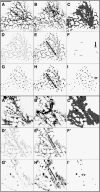
Figure 1.
Figure 1.
Persistency of Tubules, Punctae, and Cisternae of Cortical ER in Two Different Control Tobacco Epidermal Cells Expressing GFP-HDEL. The first ([A] and [A′]) and last frame ([B] and [B′]) of a 50-frame 80-s movie. Summed frames of the entire movie ([C] and [C′]), showing total imaged membrane (gray plus black) and the brighter punctae in the summed image (black). The tubule persistency map ([D] and [D′]) shows more persistent tubules as darker values. The posterized gray-level tubule persistency map ([E] and [E′]) shows high persistency (black), mid-range persistency (dark gray), and low persistency (light-gray gradient). The black arrow is positioned adjacent to an area of active streaming, showing the direction of streaming. High persistency tubules ([F] and [F′]) from (E) and (E′) that were >0.3 μm2 in area are the tubules counted in Figure 4A. In (F), the arrow indicates a persistent tubule that is subtended by persistent punctae ([I], below). The persistency map ([G] and [G′]) shows more persistent cisternae and punctae as darker values. The posterized gray-level cisternal persistency map ([H] and [H′]) shows high persistency (black), mid-range persistency (dark gray), and low persistency (light gray gradient) cisternae and punctae (arrowheads [H′] show midrange persistency punctae). The black arrow is positioned adjacent to an area of active streaming, showing the direction of streaming. The high persistency map ([I] and [I′]) from (G) and (G′) shows both the punctae (0.1 to 0.3 μm2, circularity > 0.5) and cisternae (0.3 μm2). Arrowheads show persistent punctae connected by a persistent tubule. Bar = 10 μm.
Figure 2.
Figure 2.
Persistency of Tubules, Punctae, and Cisternae of Cortical ER in a Tobacco Epidermal Cell Coexpressing GFP-HDEL and the eYFP-XIK Tail Domain. (A) to (I) Same as in Figure 1. Because there are fewer or no fast lanes in cells coexpressing myosin-XIK tails and treated with latrunculin b, the gray regions in (E) indicate regions of remodeling cisternae that are differentially skeletonized. Arrows in (H) indicate less persistent punctae associated with tubules. Arrows in (I) indicate more persistent punctae associated with cisternae. Bar = 10 μm.
Figure 3.
Figure 3.
Persistency of Tubules, Punctae, and Cisternae of Cortical ER in a Tobacco Epidermal Cell Expressing GFP-HDEL and Treated with Latrunculin b. (A) to (I) Same as in Figure 1. Arrows in (A), (E), and (I) indicate similar location near the periphery of cisternae where a persistent puncta occurs. Bar = 10 μm.
Figure 4.
Figure 4.
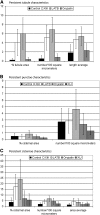
Quantification of Persistent ER Tubules and Cisternae under Various Treatment Conditions. (A) Persistent tubules in control GFP-HDEL–expressing cells (black, Control), GFP-HDEL, and eYFP-XIK tail coexpressing cells (white, XIK), latrunculin b–treated GFP-HDEL–expressing cells (light gray, LATB), and oryzalin-treated GFP-HDEL–expressing cells (gray). Columns show average value, and error bars show sd in total number of movies evaluated, n (Control, n = 30; XIK, n = 27; LATB, n = 14; oryzalin, n = 16). Percentage of tubule area is the percentage of the total imaged membrane (from summed images, refer to Figures 1 to 3C, black and gray regions) that is persistent tubules (high persistency tubules, refer to Figures 1 to 3F). Number/100 μm2 is the number of persistent tubules per 100 μm2 of total imaged membrane. Length average is the average length in micrometers of the persistent tubules. The differences between all except the control-oryzalin pair (all categories) and the XIK-LATB pair (tubule length category) are significant (P < 0.05, Tukey's HSD multiple comparisons of means, 95% family-wise confidence level). (B) Persistent punctae in control GFP-HDEL–expressing cells (black, Control), GFP-HDEL, and eYFP-XIK tail coexpressing cells (white), latrunculin b (light gray), and oryzalin (medium gray) treated GFP-HDEL–expressing cells, and GFP-HDEL and eYFP-XIJ tail coexpressing cells (dark gray). Columns show average value, and error bars show sd in total number of movies evaluated, n (Control, n = 30; XIK, n = 27; LATB, n = 14; oryzalin, n = 16; XIJ, n = 4). Percentage of cisternal area is the percentage of the total imaged membrane (from summed images, refer to Figures 1 to 3C, black and gray regions) that is persistent punctae (high persistency cisternae with areas between 0.1 and 0.3 μm2 and circularity > 0.5; refer to Figures 1 to 3I; see Supplemental Figures 2 and 3F online). Number/100 μm2 is the number of persistent punctae per 100 μm2 of total imaged membrane. The LATB treatment is significantly different (P < 0.05) from all of the other treatments, if the XIJ data are not included in the set because of low sample size. The other treatments do not significantly differ from each other (Tukey's HSD multiple comparison of means, 95% family-wise confidence level). (C) Persistent cisternae in control GFP-HDEL–expressing cells (black), GFP-HDEL and eYFP-XIK tail coexpressing cells (white), latrunculin b–treated (light gray) and oryzalin-treated (medium gray) GFP-HDEL–expressing cells, and GFP-HDEL and eYFP-XIJ tail coexpressing cells (dark gray). Columns show average value, and error bars show sd in total number of movies evaluated, n (same as [B]). Percentage of cisternal area is the percentage of the total imaged membrane (from summed images, refer to Figures 1 to 3C, black and gray regions) that is persistent cisternae (high persistency cisternae >0.3 μm2, refer to Figures 1 to 3I; see Supplemental Figures 2 and 3F online). The Control-LATB and -XIK pairs are significantly different, as are the Oryzalin-LATB and -XIK pairs and the XIJ-LATB pair (P < 0.05). Number/100 μm2 is the number of persistent cisternae per 100 μm2 of total imaged membrane. All pair comparisons except the Control-XIJ, Oryzalin-XIJ, XIK-XIJ, and Oryzalin-XIK pairs are significant (P < 0.05). Area average is the average area in μm2 of the persistent cisternae. The only pair comparisons that are significant (P < 0.05) are Control-LATB, Control-XIK, and Oryzalin-XIK. Tukey's HSD multiple comparisons of means were done at 95% family-wise confidence level.
Figure 5.
Figure 5.
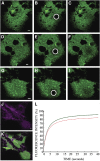
The Effect of the eYFP-XIK Tail Domain and Latrunculin b on FRAP of Tobacco Leaf Epidermal ER Marker GFP-CXN. FRAP of a bleached spot area in control cells ([A] to [C]), cells treated with latrunculin b ([D] to [F]), and those coexpressing eYFP-XIK tail domain ([G] to [I]) were quantified where prebleach ([A], [D], and [G]), bleach ([B], [E], and [H]) and 1.21 s postbleach ([C], [F], and [I]) are shown. Coexpression of GFP-CXN and the eYFP-XIK tail domain ([J]; merged GFP-CXN image in [K]) prior to the bleach experiment shown in (G) to (I) is indicated. The bleached area of GFP-CXN (circle) was monitored over time, and the fluorescence recovery was plotted ([L]; where the green line is control, black line is latrunculin b treatment, and red line is coexpression of GFP-CXN and the eYFP-XIK tail domain). Bars = 2 μm.
Figure 6.
Figure 6.
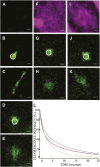
The Effect of mRFP-XIK Tail Domain, Latrunculin b, and BFA on the Mobility of CXN-Photoactivated GFP in Tobacco Leaf Epidermal ER. A spot activated area (circle) of CXN-photoactivatable GFP was generated, and its mobility out of the activation spot was monitored over time ([A] to [K]) and quantified ([L]; where the green line is control, black line is latrunculin b treatment, red line is coexpression of myosin XIK tail domain, and the blue line is BFA treatment). Mobility of CXN-paGFP in control cells ([A] to [C]), cells treated with latrunculin b ([D] and [E]), those coexpressing CXN-paGFP and the mRFP-XIK tail domain ([F] to [H]) or treated with BFA ([I] to [K]) were quantified where activation ([B], [D], [G], and [J]) and 1.93 s postactivation ([C], [E], [H], and [K]) are shown. An example of preactivation (A) highlights the lack of fluorescence prior to photoactivation in control cells. Expression of the mRFP-XIK tail domain (F) and the effect of relocation of ST-mRFP back to the ER (I) in the activation experiments shown ([F] to [K]) are indicated. Bars = 2 μm.
Figure 7.
Figure 7.
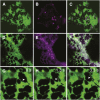
Golgi Bodies Do Not Collocate with Persistent ER Puncta in Tobacco Epidermal Cells and Do Not Affect ER Membrane Remodeling. Cells coexpressing GFP-HDEL ([A]; green) and ST-mRFP ([B]; magenta) treated with latrunculin b highlight the persistent puncta on the cisternal ER and show that the Golgi bodies do not collocate to these regions (C). Cells coexpressing GFP-HDEL and ST-mRFP were treated with BFA (3 h, 100 μg/mL) ([D] to [I]), and remodeling of the ER network was monitored over time. The Golgi marker ST-mRFP has relocated to the ER after BFA treatment, indicating Golgi body absence ([E] and merged image in [F]). Consecutive images ([G] to [I]) show that the ER network is able to remodel and tubule outgrowth still occurs (arrowhead) after BFA treatment. Bars = 2 μm.
Figure 8.
Figure 8.
Model of the Different Activities of F-Actin and Myosin at Anchor/Growth Sites in Tubule Dynamics at Nonanchored Sites and in Determining the Mobile Fraction of ER Membrane Proteins. Process 1: Tubules grow outwards, driven by actin polymerization at an anchor/growth site. The anchor site is proposed to be a region where the plasma membrane and ER are closely associated. These sites may contain actin nucleation and growth proteins. The mechanism of actin attachment to the growing tubule is represented diagrammatically as a hypothetical protein associated with the growing tubule tip at the pointed (−) end of the actin filament. Process 2: Tubules shrink or retract in the (+) direction in a myosin-dependent fashion. This is supported by Figure 4A, where both latrunculin b and myosin XI-K expression increase the length and number of persistent tubules. We interpret this as arising from an absence of shrinkage and stabilization of untethered tubules. Process 3: Less persistent anchor/growth sites can move, perhaps recruited at branch points in the actin network, indicated here by the presence of an ARP2/3 complex. There are fewer driven junctions after latrunculin b and myosin XI-K expression (Figures 2 and 3), as indicated by persistent kinks. Blind-end tubules in Figures 2 and 3 may also be anchor sites that cannot move far from the point of origin but have tubules attached. Note that three-way junctions do not require tethering to an anchor site. Process 4: Golgi do not regulate all of the growth or shrinkage of ER tubules. After BFA treatment, which deconstructs the Golgi, new ER tubules still grow and shrink (Figure 7). However, since the moving ER and moving Golgi remain closely associated, an interdependence of ER membrane movement and Golgi movement seems likely. Process 5: Myosin mediates ring closure of polygons. The association of myosin with an unanchored three-way junction is postulated, and the special nature of the junction is inferred. The observation that intact rings of the polygonal network are persistent after myosin XIK tail expression (Figures 2D to 2F) and latrunculin b treatment (Figures 3D to 3F) is evidence to support this part of the model. Process 6: Actomyosin dependence of polygon filling. Removal of myosin may result in the collapse of the corner with high angle of curvature and polygon filling, leading to cisternae and giving rise to the larger cisternal area and larger number of cisternae after myosin XIK tail expression (Figure 4C).

Similar articles

Cited by

References

    1. Adam, G., and Delbruck, M. (1968). Reduction of dimensionality in biological diffusion processes. In Structural Chemistry in Molecular Biology, A. Rich and N. Davidson, eds (San Francisco, CA: Freeman), pp. 198–215.
    1. Avisar, D., Abu-Abied, M., Belausov, E., Sadot, E., Hawes, C., and Sparkes, I.A. (2009). A comparative study of the involvement of 17 Arabidopsis myosin family members on the motility of Golgi and other organelles. Plant Physiol. 150 700–709. - PMC - PubMed
    1. Avisar, D., Prokhnevsky, A.I., Makarova, K.S., Koonin, E.V., and Dolja, V.V. (2008). Myosin XI-K is required for rapid trafficking of Golgi stacks, peroxisomes and mitochondria in leaf cells of Nicotiana benthamiana. Plant Physiol. 146 1098–1108. - PMC - PubMed
    1. Batoko, H., Zheng, H.Q., Hawes, C., and Moore, I. (2000). A Rab1 GTPase is required for transport between the endoplasmic reticulum and Golgi apparatus and for normal Golgi movement in plants. Plant Cell 12 2201–2218. - PMC - PubMed
    1. Boevink, P., Martin, B., Oparka, K., Santa Cruz, S., and Hawes, C. (1999). Transport of virally expressed green fluorescent protein through the secretory pathway in tobacco leaves is inhibited by cold shock and brefeldin A. Planta 208 392–400.

Publication types

LinkOut - more resources