

High-throughput sequencing of retrotransposon integration provides a saturated profile of target activity in Schizosaccharomyces pombe
- PMID: 20040583
- PMCID: PMC2813479
- DOI: 10.1101/gr.099648.109
High-throughput sequencing of retrotransposon integration provides a saturated profile of target activity in Schizosaccharomyces pombe
Abstract
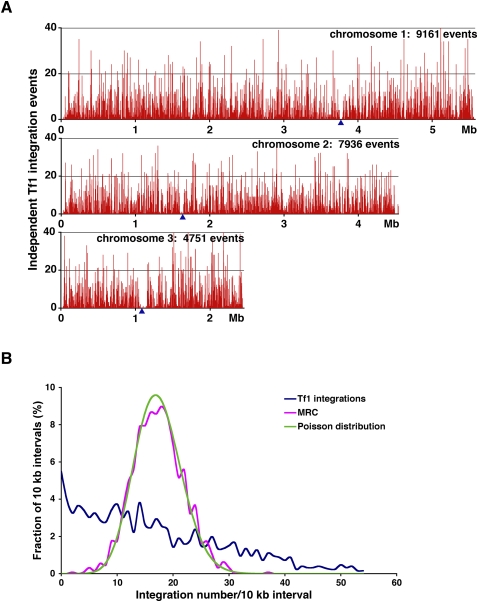
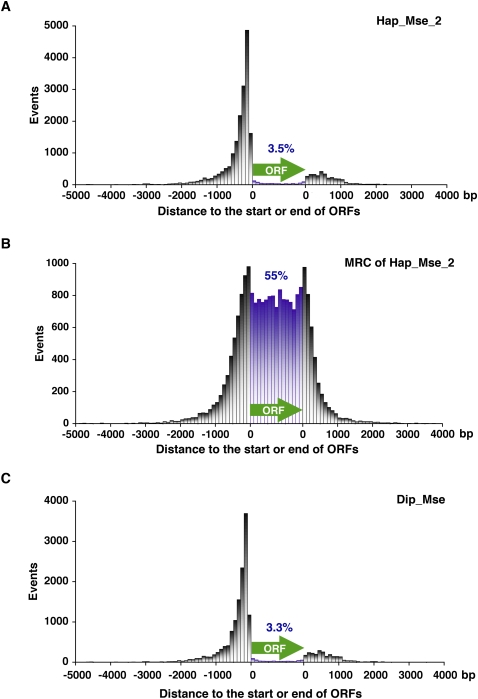
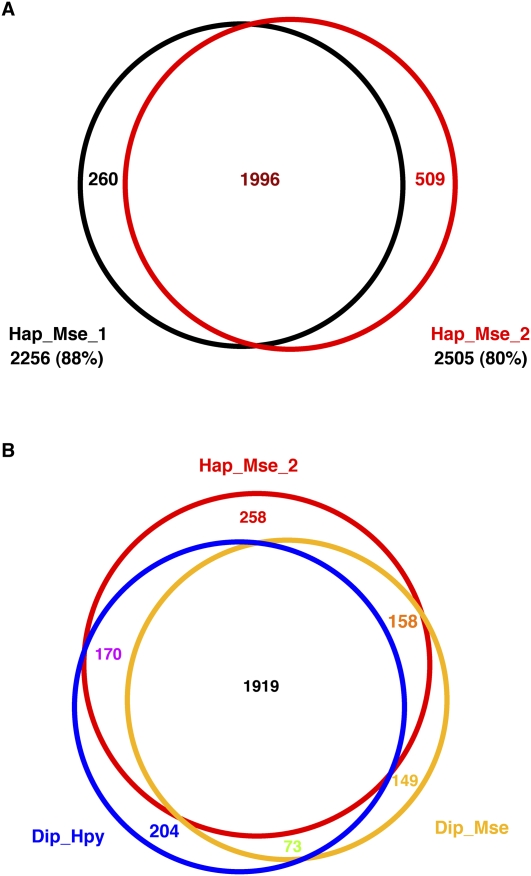
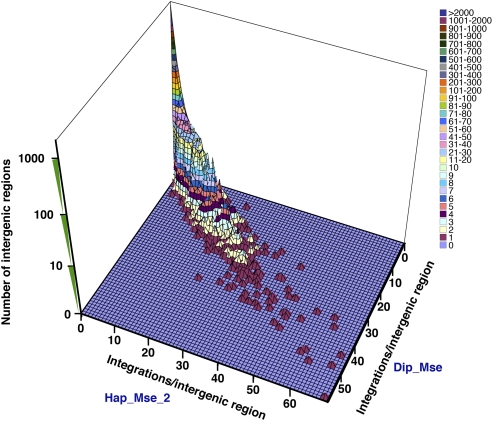
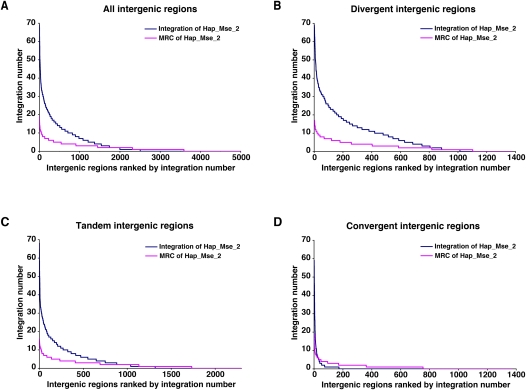
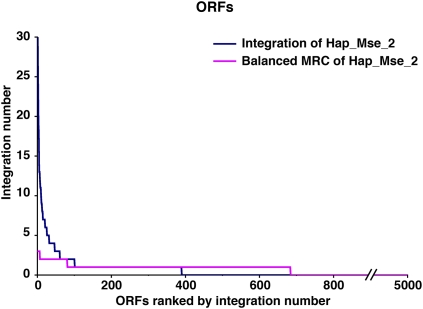
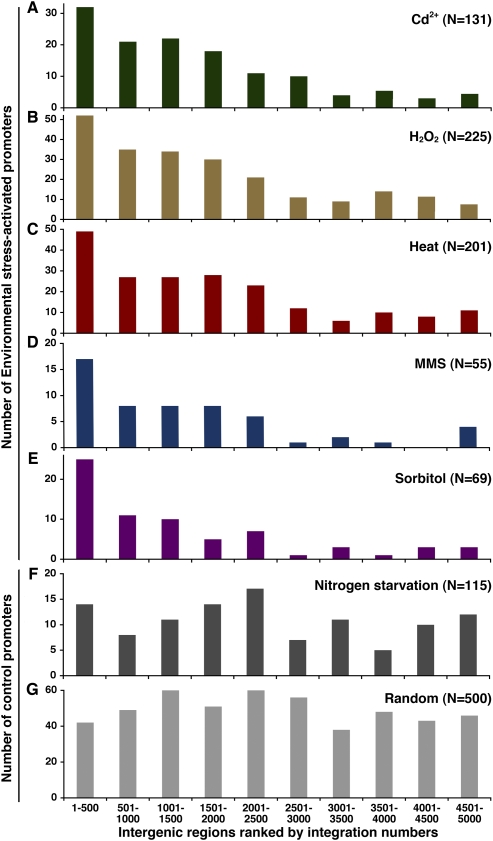
The biological impact of transposons on the physiology of the host depends greatly on the frequency and position of integration. Previous studies of Tf1, a long terminal repeat retrotransposon in Schizosaccharomyces pombe, showed that integration occurs at the promoters of RNA polymerase II (Pol II) transcribed genes. To determine whether specific promoters are preferred targets of integration, we sequenced large numbers of insertions using high-throughput pyrosequencing. In four independent experiments we identified a total of 73,125 independent integration events. These data provided strong support for the conclusion that Pol II promoters are the targets of Tf1 integration. The size and number of the integration experiments resulted in reproducible measures of integration for each intergenic region and ORF in the S. pombe genome. The reproducibility of the integration activity from experiment to experiment demonstrates that we have saturated the full set of insertion sites that are actively targeted by Tf1. We found Tf1 integration was highly biased in favor of a specific set of Pol II promoters. The overwhelming majority (76%) of the insertions were distributed in intergenic sequences that contained 31% of the promoters of S. pombe. Interestingly, there was no correlation between the amount of integration at these promoters and their level of transcription. Instead, we found Tf1 had a strong preference for promoters that are induced by conditions of stress. This targeting of stress response genes coupled with the ability of Tf1 to regulate the expression of adjacent genes suggests Tf1 may improve the survival of S. pombe when cells are exposed to environmental stress.
Figures
Similar articles
-
Retrotransposons and their recognition of pol II promoters: a comprehensive survey of the transposable elements from the complete genome sequence of Schizosaccharomyces pombe.Genome Res. 2003 Sep;13(9):1984-97. doi: 10.1101/gr.1191603. Genome Res. 2003. PMID: 12952871 Free PMC article.
-
Determinants that specify the integration pattern of retrotransposon Tf1 in the fbp1 promoter of Schizosaccharomyces pombe.J Virol. 2011 Jan;85(1):519-29. doi: 10.1128/JVI.01719-10. Epub 2010 Oct 27. J Virol. 2011. PMID: 20980525 Free PMC article.
-
Retrotransposon Tf1 is targeted to Pol II promoters by transcription activators.Mol Cell. 2008 Apr 11;30(1):98-107. doi: 10.1016/j.molcel.2008.02.016. Mol Cell. 2008. PMID: 18406330 Free PMC article.
-
The Long Terminal Repeat Retrotransposons Tf1 and Tf2 of Schizosaccharomyces pombe.Microbiol Spectr. 2015 Aug;3(4):10.1128/microbiolspec.MDNA3-0040-2014. doi: 10.1128/microbiolspec.MDNA3-0040-2014. Microbiol Spectr. 2015. PMID: 26350316 Free PMC article. Review.
-
RNA polymerase II transcription apparatus in Schizosaccharomyces pombe.Curr Genet. 2004 Jan;44(6):287-94. doi: 10.1007/s00294-003-0446-8. Epub 2003 Oct 22. Curr Genet. 2004. PMID: 14574615 Review.
Cited by
-
Retrotransposon Ty1 integration targets specifically positioned asymmetric nucleosomal DNA segments in tRNA hotspots.Genome Res. 2012 Apr;22(4):693-703. doi: 10.1101/gr.129460.111. Epub 2012 Jan 4. Genome Res. 2012. PMID: 22219510 Free PMC article.
-
Analysis of phage Mu DNA transposition by whole-genome Escherichia coli tiling arrays reveals a complex relationship to distribution of target selection protein B, transcription and chromosome architectural elements.J Biosci. 2011 Sep;36(4):587-601. doi: 10.1007/s12038-011-9108-z. J Biosci. 2011. PMID: 21857106 Free PMC article.
-
Repression of a large number of genes requires interplay between homologous recombination and HIRA.Nucleic Acids Res. 2021 Feb 26;49(4):1914-1934. doi: 10.1093/nar/gkab027. Nucleic Acids Res. 2021. PMID: 33511417 Free PMC article.
-
The Transposable Element Environment of Human Genes Differs According to Their Duplication Status and Essentiality.Genome Biol Evol. 2021 May 7;13(5):evab062. doi: 10.1093/gbe/evab062. Genome Biol Evol. 2021. PMID: 33973013 Free PMC article.
-
Genome walking by next generation sequencing approaches.Biology (Basel). 2012 Oct 1;1(3):495-507. doi: 10.3390/biology1030495. Biology (Basel). 2012. PMID: 24832505 Free PMC article.
References
Publication types
MeSH terms
Substances
Grants and funding
LinkOut - more resources
Full Text Sources