. 2009 Dec 21;4(12):e8378.
doi: 10.1371/journal.pone.0008378.

The evolutionary history of protein domains viewed by species phylogeny

Affiliations

The evolutionary history of protein domains viewed by species phylogeny

Song Yang et al. PLoS One. .

Abstract

Background: Protein structural domains are evolutionary units whose relationships can be detected over long evolutionary distances. The evolutionary history of protein domains, including the origin of protein domains, the identification of domain loss, transfer, duplication and combination with other domains to form new proteins, and the formation of the entire protein domain repertoire, are of great interest.

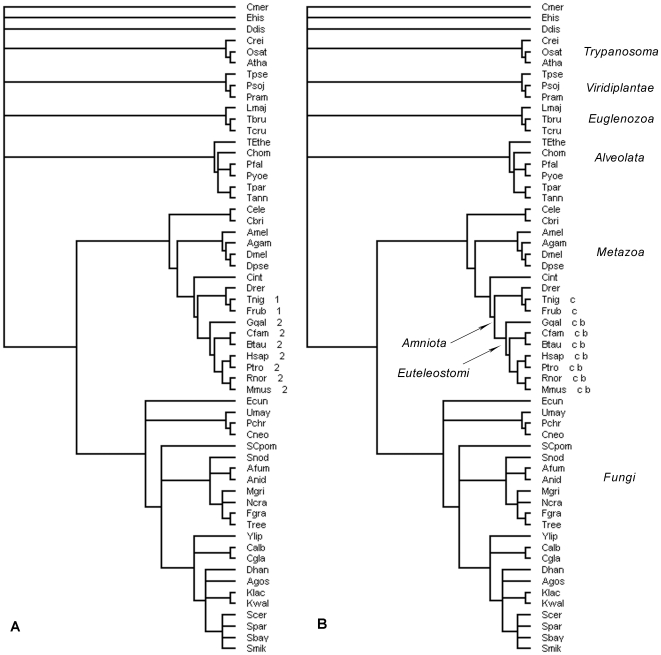
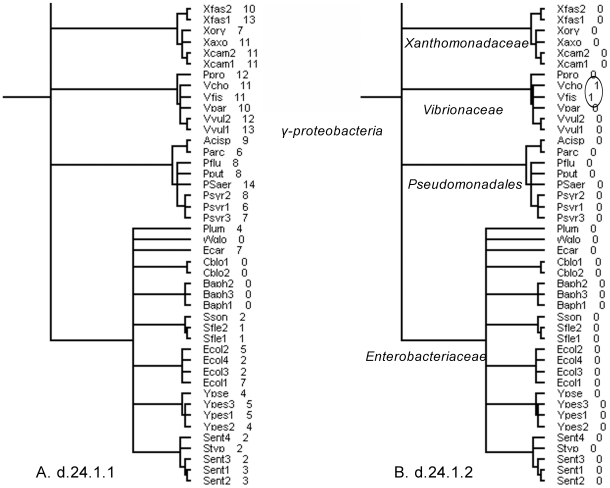
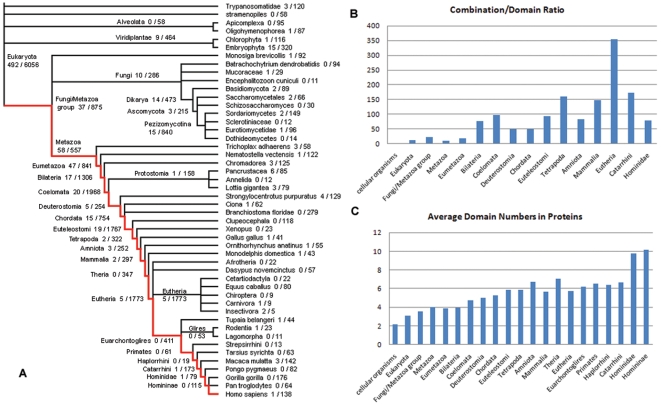
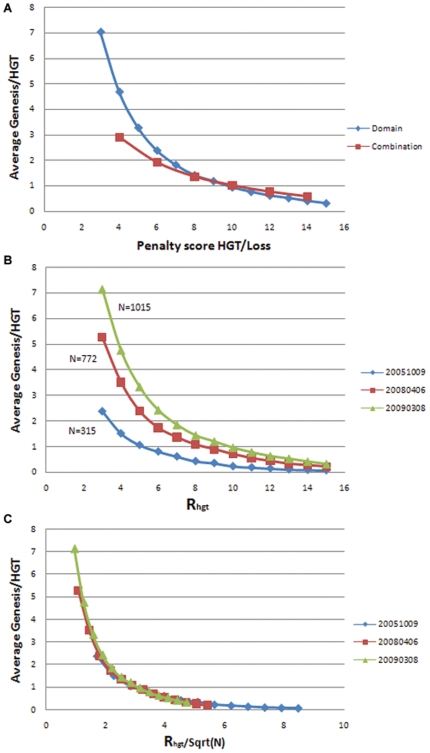
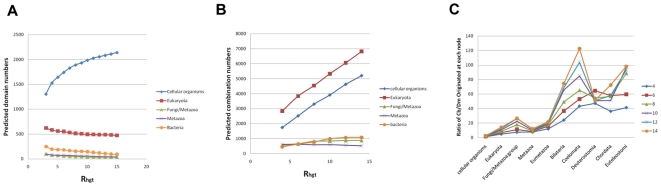
Methodology/principal findings: A methodology is presented for providing a parsimonious domain history based on gain, loss, vertical and horizontal transfer derived from the complete genomic domain assignments of 1015 organisms across the tree of life. When mapped to species trees the evolutionary history of domains and domain combinations is revealed, and the general evolutionary trend of domain and combination is analyzed.

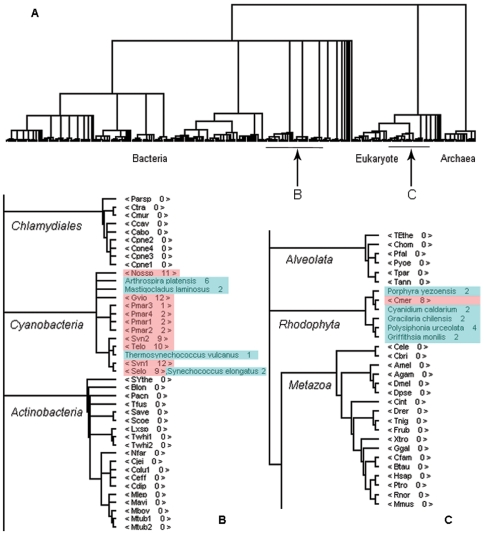
Conclusions/significance: We show that this approach provides a powerful tool to study how new proteins and functions emerged and to study such processes as horizontal gene transfer among more distant species.


Conflict of interest statement

Competing Interests: The authors have declared that no competing interests exist.

Figures

Figure 1
Figure 1. Comparison of domain tree and domain combination tree.
Single domains and domain combinations mapped to the eukaryotic tree for SCOP domain a.109.1.1, the Class II MHC-associated invariant chain ectoplasmic trimerization domain. (A) The number next to the species name represents the abundance of the domain in the genome of that species. (B) The letters represent different combination types. In this case, type b corresponds to N/A∼a.109.1.1 and c represents N/A∼a.109.1.1∼g.28.1.1, where N/A is an unknown domain (no 3D structure, no SCOP id). The complete scientific names of the taxa in this study are listed in the supplementary Table S1.
Figure 2
Figure 2. The evolutionary relationship of two families by comparing their domain trees.
The domain trees of (A) the pilin family (d.24.1.1) and (B) the TcpA-like family (d.24.1.2). Both families exist exclusively in bacteria. Only part of the proteobacteria taxa within the bacteria are shown; the complete proteobacteria tree can be found in supplementary Figure S1. The number next to each species represents the abundance of the domain family.
Figure 3
Figure 3. The PDB-validated domain trees of phycocyanin-like phycobilisome proteins (a.1.1.3).
(A) The patchy distribution of a.1.1.3 on the tree of life. (B) Part of the bacteria tree zoomed in; a.1.1.3 exists only in cyanobacteria. (C) In the expanded (from Fig. 3A) eukaryote tree, a.1.1.3 only appears in all red algae (Rhodophyta) species, including Cmer in our complete genome dataset and five red algae species with solved 3D structures. The red highlight in (B) and (C) indicates domains predicted to exist in the complete genomes based on SUPERFAMILY data; blue highlight in (B) and (C) represents the organisms that comprise the a.1.1.3 domain whose 3D structures are deposited in the PDB.
Figure 4
Figure 4. The general evolutionary trend of protein domains and domain combinations.
(A) The predicted number of domains/domain combinations originating at each node on the eukaryotic tree. (B) The combination/domain ratio at each node along the evolutionary path from the root of the tree to Homo sapiens indicated by the red line in Fig. 4A. (C) The average number of domains in the domain combination originating from each node along the same evolutionary path.
Figure 5
Figure 5. The predicted average HGT or independent genesis events.
(A) The average number of HGT or independent genesis per domain/combination with respect to the relative penalty score of Genesis/HGT to loss varying from 3 to 15. (B) Comparison of average Genesis/HGT vs. Rhgt for three SUPERFAMILY releases: Oct 9th 2005, Aug 6th 2008 and Mar 8th 2009, containing 315, 772 and 1015 species respectively. (C) The same plot with the ratio normalized by an empirical factor. The new ratio is Rn = Rhgt/Sqrt(N), N is the total number of species in each release.
Figure 6
Figure 6. The impact of the relative penalty score Rhgt.
(A–B) The predicted numbers of domains (A) and domain combinations (B) originating from six ancestral nodes (LUCA, Eukaryota, Fungi/Metazoa, Metazoa and Bacteria) with respect to different Rhgt values (C) The impact of the Rhgt value on the ratio of the number of combinations over the number of domains originated at each ancestral node along the same evolutionary path as in Figure 4B.

References

    1. Doolittle RF. The multiplicity of domains in proteins. Annu Rev Biochem. 1995;64:287–314. - PubMed
    1. Chothia C, Gough J, Vogel C, Teichmann SA. Evolution of the protein repertoire. Science. 2003;300:1701–1703. - PubMed
    1. Lin J, Gerstein M. Whole-genome trees based on the occurrence of folds and orthologs: implications for comparing genomes on different levels. Genome Res. 2000;10:808–818. - PMC - PubMed
    1. Caetano-Anolles G, Caetano-Anolles D. An evolutionarily structured universe of protein architecture. Genome Res. 2003;13:1563–1571. - PMC - PubMed
    1. Yang S, Doolittle RF, Bourne PE. Phylogeny determined by protein domain content. Proc Natl Acad Sci U S A. 2005;102:373–378. - PMC - PubMed

Publication types