AutoEPG: software for the analysis of electrical activity in the microcircuit underpinning feeding behaviour of Caenorhabditis elegans
- PMID: 20041123
- PMCID: PMC2795780
- DOI: 10.1371/journal.pone.0008482
AutoEPG: software for the analysis of electrical activity in the microcircuit underpinning feeding behaviour of Caenorhabditis elegans
Abstract
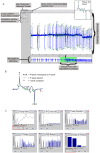
Background: The pharyngeal microcircuit of the nematode Caenorhabditis elegans serves as a model for analysing neural network activity and is amenable to electrophysiological recording techniques. One such technique is the electropharyngeogram (EPG) which has provided insight into the genetic basis of feeding behaviour, neurotransmission and muscle excitability. However, the detailed manual analysis of the digital recordings necessary to identify subtle differences in activity that reflect modulatory changes within the underlying network is time consuming and low throughput. To address this we have developed an automated system for the high-throughput and discrete analysis of EPG recordings (AutoEPG).
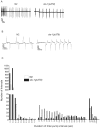
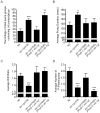
Methodology/principal findings: AutoEPG employs a tailor made signal processing algorithm that automatically detects different features of the EPG signal including those that report on the relaxation and contraction of the muscle and neuronal activity. Manual verification of the detection algorithm has demonstrated AutoEPG is capable of very high levels of accuracy. We have further validated the software by analysing existing mutant strains with known pharyngeal phenotypes detectable by the EPG. In doing so, we have more precisely defined an evolutionarily conserved role for the calcium-dependent potassium channel, SLO-1, in modulating the rhythmic activity of neural networks.
Conclusions/significance: AutoEPG enables the consistent analysis of EPG recordings, significantly increases analysis throughput and allows the robust identification of subtle changes in the electrical activity of the pharyngeal nervous system. It is anticipated that AutoEPG will further add to the experimental tractability of the C. elegans pharynx as a model neural circuit.
Conflict of interest statement
Figures


Similar articles
-
Neuroligin tuning of pharyngeal pumping reveals extrapharyngeal modulation of feeding in Caenorhabditis elegans.J Exp Biol. 2019 Feb 8;222(Pt 3):jeb189423. doi: 10.1242/jeb.189423. J Exp Biol. 2019. PMID: 30559302
-
The calcium-activated potassium channel, SLO-1, is required for the action of the novel cyclo-octadepsipeptide anthelmintic, emodepside, in Caenorhabditis elegans.Int J Parasitol. 2007 Dec;37(14):1577-88. doi: 10.1016/j.ijpara.2007.05.006. Epub 2007 May 21. Int J Parasitol. 2007. PMID: 17583712
-
Pharyngeal pumping in Caenorhabditis elegans depends on tonic and phasic signaling from the nervous system.Sci Rep. 2016 Mar 15;6:22940. doi: 10.1038/srep22940. Sci Rep. 2016. PMID: 26976078 Free PMC article.
-
Serotonergic modulation of feeding behavior in Caenorhabditis elegans and other related nematodes.Neurosci Res. 2020 May;154:9-19. doi: 10.1016/j.neures.2019.04.006. Epub 2019 Apr 24. Neurosci Res. 2020. PMID: 31028772 Review.
-
SLO, SLO, quick, quick, slow: calcium-activated potassium channels as regulators of Caenorhabditis elegans behaviour and targets for anthelmintics.Invert Neurosci. 2007 Dec;7(4):199-208. doi: 10.1007/s10158-007-0057-z. Epub 2007 Oct 26. Invert Neurosci. 2007. PMID: 17962986 Review.
Cited by
-
Distinct molecular targets including SLO-1 and gap junctions are engaged across a continuum of ethanol concentrations in Caenorhabditis elegans.FASEB J. 2013 Oct;27(10):4266-78. doi: 10.1096/fj.11-189340. Epub 2013 Jul 23. FASEB J. 2013. PMID: 23882127 Free PMC article.
-
NeuroChip: a microfluidic electrophysiological device for genetic and chemical biology screening of Caenorhabditis elegans adult and larvae.PLoS One. 2013 May 22;8(5):e64297. doi: 10.1371/journal.pone.0064297. Print 2013. PLoS One. 2013. PMID: 23717588 Free PMC article.
-
Anthelmintic drug actions in resistant and susceptible C. elegans revealed by electrophysiological recordings in a multichannel microfluidic device.Int J Parasitol Drugs Drug Resist. 2018 Dec;8(3):607-628. doi: 10.1016/j.ijpddr.2018.10.003. Epub 2018 Oct 30. Int J Parasitol Drugs Drug Resist. 2018. PMID: 30503202 Free PMC article.
-
Arrhythmogenic effects of mutated L-type Ca 2+-channels on an optogenetically paced muscular pump in Caenorhabditis elegans.Sci Rep. 2015 Sep 24;5:14427. doi: 10.1038/srep14427. Sci Rep. 2015. PMID: 26399900 Free PMC article.
-
Worms take to the slo lane: a perspective on the mode of action of emodepside.Invert Neurosci. 2012 Jun;12(1):29-36. doi: 10.1007/s10158-012-0133-x. Epub 2012 Apr 27. Invert Neurosci. 2012. PMID: 22539031 Free PMC article. Review.
References
-
- de Bono M, Maricq AV. Neuronal substrates of complex behaviors in C. elegans. Annu Rev Neurosci. 2005;28:451–501. - PubMed
-
- Buckingham SD, Sattelle DB. Strategies for automated analysis of C. elegans locomotion. Invert Neurosci. 2008;8:121–131. - PubMed
-
- Cronin CJ, Feng Z, Schafer WR. Automated imaging of C. elegans behavior. Methods Mol Biol. 2006;351:241–251. - PubMed
Publication types
MeSH terms
Substances
Grants and funding
LinkOut - more resources
Full Text Sources

