. 2009 Dec 29;4(12):e8260.
doi: 10.1371/journal.pone.0008260.

Explaining the imperfection of the molecular clock of hominid mitochondria

Affiliations

Explaining the imperfection of the molecular clock of hominid mitochondria

Eva-Liis Loogväli et al. PLoS One. .

Abstract

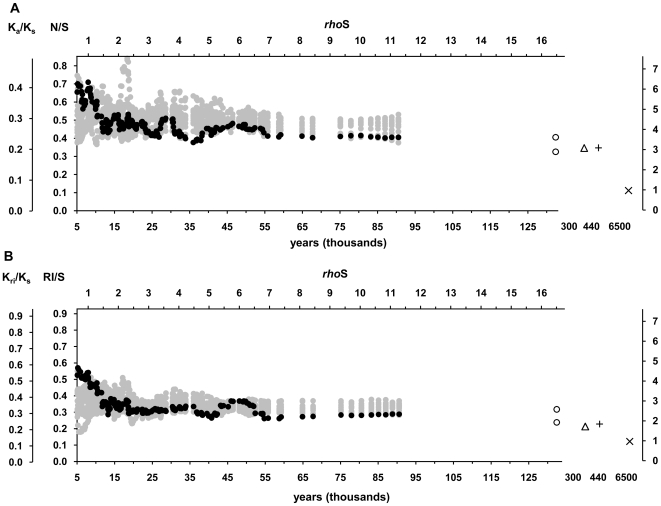
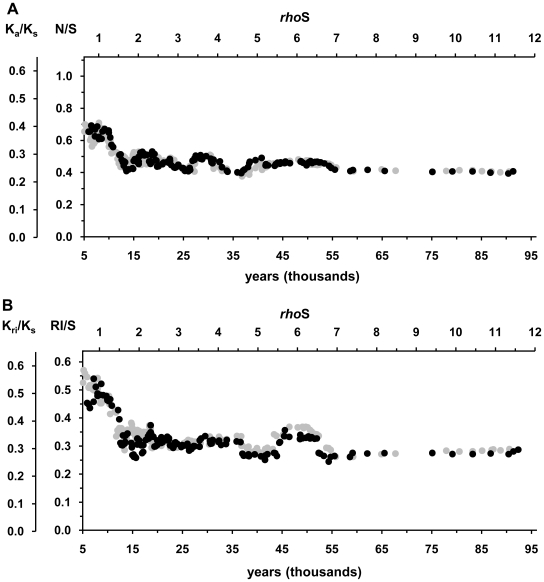
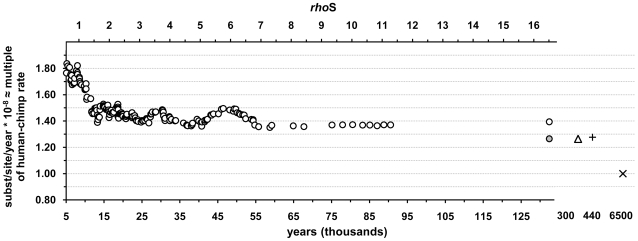
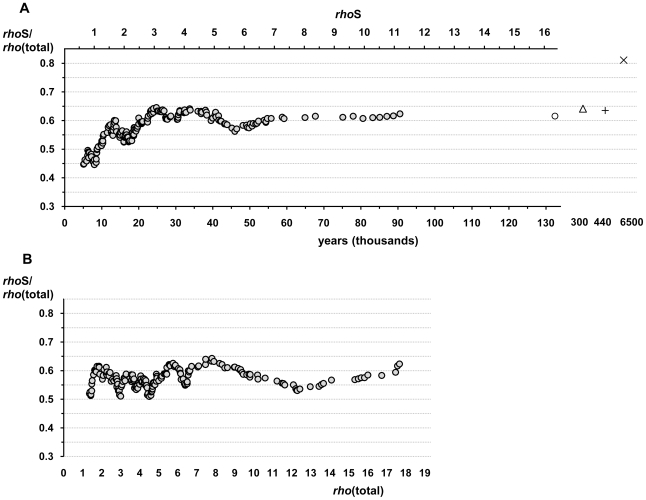
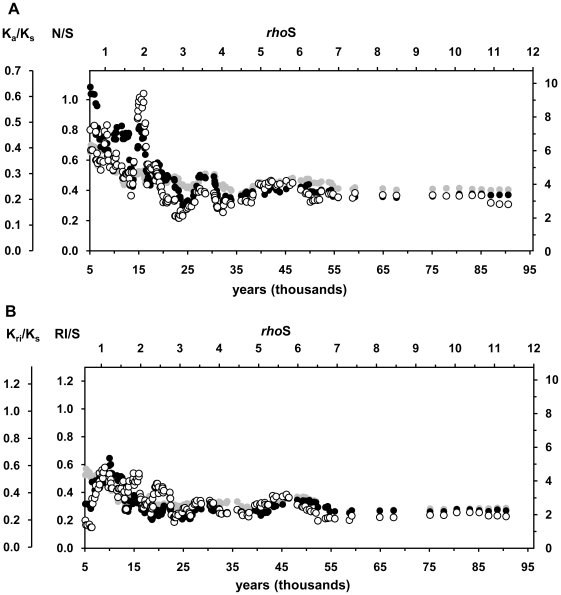
The molecular clock of mitochondrial DNA has been extensively used to date various genetic events. However, its substitution rate among humans appears to be higher than rates inferred from human-chimpanzee comparisons, limiting the potential of interspecies clock calibrations for intraspecific dating. It is not well understood how and why the substitution rate accelerates. We have analyzed a phylogenetic tree of 3057 publicly available human mitochondrial DNA coding region sequences for changes in the ratios of mutations belonging to different functional classes. The proportion of non-synonymous and RNA genes substitutions has reduced over hundreds of thousands of years. The highest mutation ratios corresponding to fast acceleration in the apparent substitution rate of the coding sequence have occurred after the end of the Last Ice Age. We recalibrate the molecular clock of human mtDNA as 7990 years per synonymous mutation over the mitochondrial genome. However, the distribution of substitutions at synonymous sites in human data significantly departs from a model assuming a single rate parameter and implies at least 3 different subclasses of sites. Neutral model with 3 synonymous substitution rates can explain most, if not all, of the apparent molecular clock difference between the intra- and interspecies levels. Our findings imply the sluggishness of purifying selection in removing the slightly deleterious mutations from the human as well as the Neandertal and chimpanzee populations. However, for humans, the weakness of purifying selection has been further exacerbated by the population expansions associated with the out-of Africa migration and the end of the Last Ice Age.


Conflict of interest statement

Competing Interests: The authors have declared that no competing interests exist.

Figures

Figure 1
Figure 1. Temporal changes in the fractions of non-synonymous (A) and RNA plus intergenic mutations (B).
N/S – average ratio of non-synonymous to synonymous mutations of the clades belonging to the same time-window. Ka/Ks – relative substitution rate of non-synonymous mutations per non-synonymous site in respect of the rate of synonymous mutations per such a site. RI/S and Kri/Ks give the relative mutation rates of RNA genes plus intergenic regions. Black dots represent the estimates based on the empirical dataset. Grey dots show the estimates from the reference dataset with a uniform distribution of mutations. Open circles show the values for the 4 oldest clades. The lower open circle shows the substitution rate without counting the mutations from the youngest branches, those that carried only 1 or 2 individuals. Open triangle shows the substitution rate between two chimpanzee sequences (X93335 and EU095335 [56]). The plus sign and cross represent data points for the comparisons of human(rCRS)-Neandertal and human(rCRS) -chimpanzee , respectively. The upper axis (rhoS) gives the ages as average amount of accumulated synonymous substitutions. The lower axis shows the ages in calendar years, with 1 rhoS corresponding to 7990 years. The right axis gives relative changes in respect of the substitution rate inferred from the human-chimpanzee comparison. See the details of the sliding window analysis and estimates for the Neandertal and chimpanzee sequences in the text and Methods .
Figure 2
Figure 2. Temporal changes in the fractions of non-synonymous (A) and RNA plus intergenic mutations (B) after the removal of sub-trees defined by mutations favored by positive selection.
These mutations were A5539G, A5592G, T7581C, G7521A, G1438A, T1452C, G3010A, T3027C and A12172G. Black dots represent the results after the removal of the mutations and grey dots show the results of the full dataset (Figure 1). The upper axis (rhoS) gives the ages as average amount of accumulated synonymous transitions. The lower axis shows the ages in calendar years, with 1 rhoS corresponding to 7990 years. The sliding window analysis was performed as with full dataset, except that 143 windows were analyzed. See the additional details in the text, Figure 1 legend and Methods .
Figure 3
Figure 3. Changes in the overall substitution rate of the coding region.
The rates shown are approximately the same as multiple of the rate derived from the human-chimpanzee comparison because this rate is close to 1 substitution/site/year. The last open circle shows the value for the 4 oldest clades. The grey circle shows the apparent substitution rate for the 4 oldest clades without counting the mutations from the youngest branches, those that carried only 1 or 2 individuals. Open triangle shows the substitution rate derived from the comparison of two chimpanzee sequences. The plus sign and cross represent data points for the comparisons of human-Neandertal and human-chimpanzee, respectively. The upper axis (rhoS) gives the ages as average amount of accumulated synonymous substitutions. The lower axis shows the ages in calendar years. See the details in Figure 1 legend and in the Methods .
Figure 4
Figure 4. Changes in the fraction of synonymous substitutions.
The dataset of coalescence ages was sorted according to the accumulated amount of synonymous variation (A) or total variation (B) and the sliding window analysis was performed as with the other mutation ratios (see Methods ). Open circle shows the values for the 4 oldest clades. Open triangle shows the substitution rate derived from the comparison of two chimpanzee sequences. The plus sign and cross represent data points for the comparisons of human-Neandertal and human-chimpanzee, respectively. See the details in Figure 1 legend and in the Methods . Note that the time axis derived from total variation on panel B is in fact not linear, contrary to what is shown in panel A. The values on panel B have been stretched out along the younger end of the dataset because of the generally higher fraction of non-synonymous and RNA gene mutations there.
Figure 5
Figure 5. Temporal changes in the relative rates of non-synonymous (A) and RNA plus intergenic mutations (B) without counting the mutations from the branches that carried only 1 or 2 individuals.
Black dots represent the results after the removal of terminal branches, open circles represent the outcome after further removal of the branches that carried 2 individuals, and grey dots show the results of the full dataset (Figure 1). The clade ages were taken from the analysis of full dataset. The upper axis (rhoS) gives the ages as average amount of accumulated synonymous substitutions. The lower axis shows the ages in calendar years, with 1 rhoS corresponding to 7990 years. The right axis gives relative changes in respect of the substitution rate inferred from the human-chimpanzee comparison. The sliding window analysis was performed as with full dataset. See the details in the text and Methods .

Similar articles

Cited by

References

    1. Zuckerkandl E, Pauling L. Molecular disease, evolution, and genetic heterogeneity. In: Kasha M, Pullman B, editors. Horizons in Biochemistry. New York: Academic Press; 1962. pp. 189–225.
    1. Kumar S. Molecular clocks: four decades of evolution. Nat Rev Genet. 2005;6:654–662. - PubMed
    1. Bromham L, Penny D. The modern molecular clock. Nat Rev Genet. 2003;4:216–224. - PubMed
    1. Avise JC. Phylogeography: The History and Formation of Species. Cambridge, Massachusetts: Harvard University Press; 2000.
    1. Torroni A, Achilli A, Macaulay V, Richards M, Bandelt H. Harvesting the fruit of the human mtDNA tree. Trends Genet. 2006;22:339–345. - PubMed

Publication types