

Cholesterol homeostasis in two commonly used human prostate cancer cell-lines, LNCaP and PC-3
- PMID: 20041144
- PMCID: PMC2794383
- DOI: 10.1371/journal.pone.0008496
Cholesterol homeostasis in two commonly used human prostate cancer cell-lines, LNCaP and PC-3
Abstract
Background: Recently, there has been renewed interest in the link between cholesterol and prostate cancer. It has been previously reported that in vitro, prostate cancer cells lack sterol-mediated feedback regulation of the major transcription factor in cholesterol homeostasis, sterol-regulatory element binding protein 2 (SREBP-2). This could explain the accumulation of cholesterol observed in clinical prostate cancers. Consequently, perturbed feedback regulation to increased sterol levels has become a pervasive concept in the prostate cancer setting. Here, we aimed to explore this in greater depth.
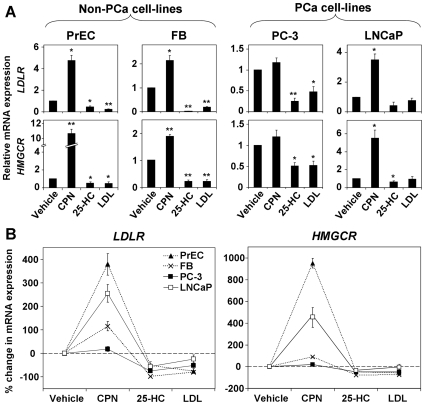
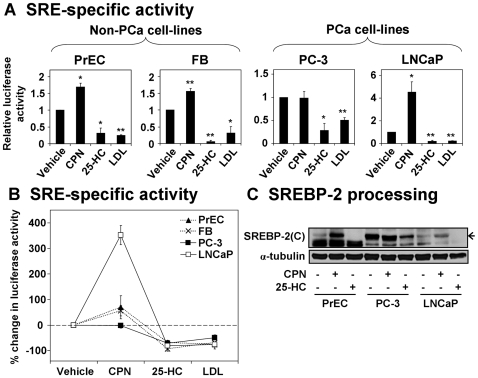
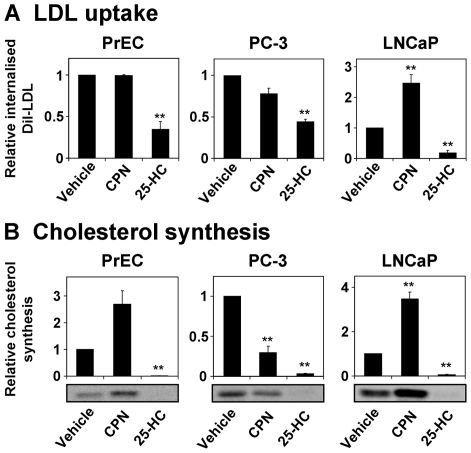
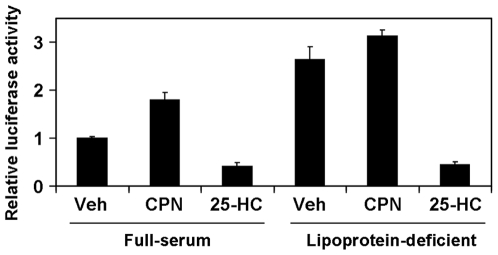
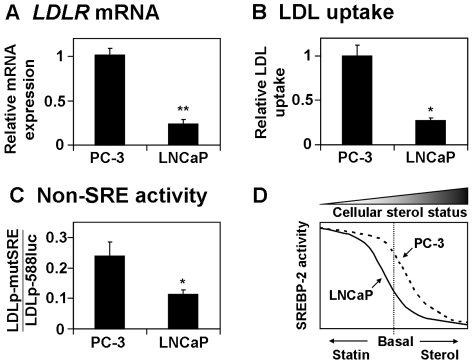
Methodology/principal findings: After altering the cellular cholesterol status in LNCaP and PC-3 prostate cancer cells, we examined SREBP-2 processing, downstream effects on promoter activity and expression of SREBP-2 target genes, and functional activity (low-density lipoprotein uptake, cholesterol synthesis). In doing so, we observed that LNCaP and PC-3 cells were sensitive to increased sterol levels. In contrast, lowering cholesterol levels via statin treatment generated a greater response in LNCaP cells than PC-3 cells. This highlighted an important difference between these cell-lines: basal SREBP-2 activity appeared to be higher in PC-3 cells, reducing sensitivity to decreased cholesterol levels.
Conclusion/significance: Thus, prostate cancer cells are sensitive to changing sterol levels in vitro, but the extent of this regulation differs between prostate cancer cell-lines. These results shed new light on the regulation of cholesterol metabolism in two commonly used prostate cancer cell-lines, and emphasize the importance of establishing whether or not cholesterol homeostasis is perturbed in prostate cancer in vivo.
Conflict of interest statement
Figures
Similar articles
-
Does changing androgen receptor status during prostate cancer development impact upon cholesterol homeostasis?PLoS One. 2013;8(1):e54007. doi: 10.1371/journal.pone.0054007. Epub 2013 Jan 8. PLoS One. 2013. PMID: 23320115 Free PMC article.
-
The importance of LDL and cholesterol metabolism for prostate epithelial cell growth.PLoS One. 2012;7(6):e39445. doi: 10.1371/journal.pone.0039445. Epub 2012 Jun 27. PLoS One. 2012. PMID: 22761797 Free PMC article.
-
Overexpression of a key regulator of lipid homeostasis, Scap, promotes respiration in prostate cancer cells.FEBS Lett. 2013 Apr 2;587(7):983-8. doi: 10.1016/j.febslet.2013.02.040. Epub 2013 Feb 27. FEBS Lett. 2013. PMID: 23454642
-
Maintaining cholesterol homeostasis: sterol regulatory element-binding proteins.World J Gastroenterol. 2004 Nov 1;10(21):3081-7. doi: 10.3748/wjg.v10.i21.3081. World J Gastroenterol. 2004. PMID: 15457548 Free PMC article. Review.
-
Sterol metabolism and SREBP activation.Arch Biochem Biophys. 2010 Sep 15;501(2):177-81. doi: 10.1016/j.abb.2010.06.004. Epub 2010 Jun 10. Arch Biochem Biophys. 2010. PMID: 20541520 Review.
Cited by
-
An essential requirement for the SCAP/SREBP signaling axis to protect cancer cells from lipotoxicity.Cancer Res. 2013 May 1;73(9):2850-62. doi: 10.1158/0008-5472.CAN-13-0382-T. Epub 2013 Feb 25. Cancer Res. 2013. PMID: 23440422 Free PMC article.
-
Twin enzymes, divergent control: The cholesterogenic enzymes DHCR14 and LBR are differentially regulated transcriptionally and post-translationally.J Biol Chem. 2020 Feb 28;295(9):2850-2865. doi: 10.1074/jbc.RA119.011323. Epub 2020 Jan 7. J Biol Chem. 2020. PMID: 31911440 Free PMC article.
-
The Non Catalytic Protein ERG28 has a Functional Role in Cholesterol Synthesis and is Coregulated Transcriptionally.J Lipid Res. 2022 Dec;63(12):100295. doi: 10.1016/j.jlr.2022.100295. Epub 2022 Oct 8. J Lipid Res. 2022. PMID: 36216146 Free PMC article.
-
Cholesterol as a potential target for castration-resistant prostate cancer.Pharm Res. 2011 Mar;28(3):423-37. doi: 10.1007/s11095-010-0210-y. Epub 2010 Aug 4. Pharm Res. 2011. PMID: 20683646 Review.
-
The terminal enzymes of cholesterol synthesis, DHCR24 and DHCR7, interact physically and functionally.J Lipid Res. 2015 Apr;56(4):888-97. doi: 10.1194/jlr.M056986. Epub 2015 Jan 31. J Lipid Res. 2015. PMID: 25637936 Free PMC article.
References
-
- Swyer GIM. The cholesterol content of normal and enlarged prostates. Cancer Res. 1942;2:372–375.
-
- Brown AJ. Cholesterol, statins and cancer. Clin Exp Pharmacol Physiol. 2007;34:135–141. - PubMed
-
- Hager MH, Solomon KR, Freeman MR. The role of cholesterol in prostate cancer. Curr Opin Clin Nutr Metab Care. 2006;9:379–385. - PubMed
-
- Solomon KR, Freeman MR. Do the cholesterol-lowering properties of statins affect cancer risk? Trends Endocrinol Metab. 2008;19:113–121. - PubMed
-
- Locke JA, Wasan KM, Nelson CC, Guns ES, Leon CG. Androgen-mediated cholesterol metabolism in LNCaP and PC-3 cell lines is regulated through two different isoforms of acyl-coenzyme A:Cholesterol Acyltransferase (ACAT). Prostate. 2008;68:20–33. - PubMed
Publication types
MeSH terms
Substances
LinkOut - more resources
Full Text Sources
Medical
