. 2009 Dec 24;4(12):e8460.
doi: 10.1371/journal.pone.0008460.

The ZEB1 transcription factor is a novel repressor of adiposity in female mice

Affiliations

The ZEB1 transcription factor is a novel repressor of adiposity in female mice

Jessica N Saykally et al. PLoS One. .

Abstract

Background: Four genome-wide association studies mapped an "obesity" gene to human chromosome 10p11-12. As the zinc finger E-box binding homeobox 1 (ZEB1) transcription factor is encoded by the TCF8 gene located in that region, and as it influences the differentiation of various mesodermal lineages, we hypothesized that ZEB1 might also modulate adiposity. The goal of these studies was to test that hypothesis in mice.

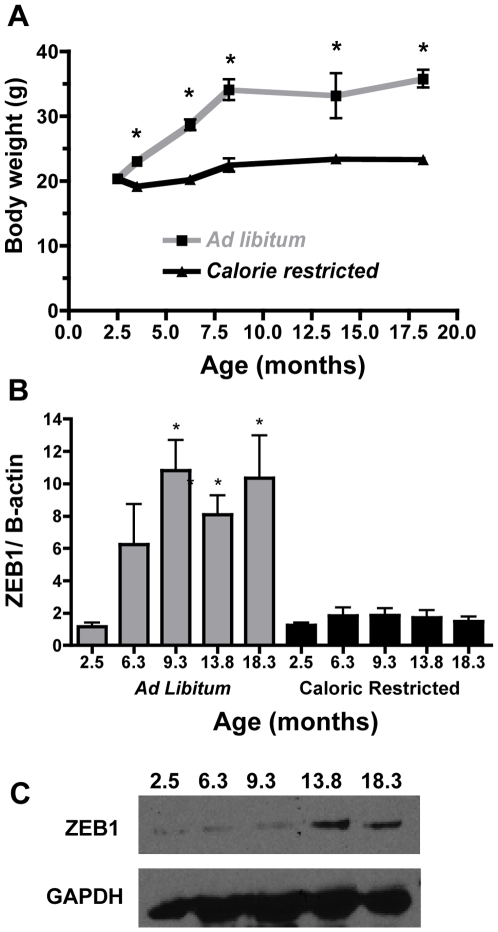
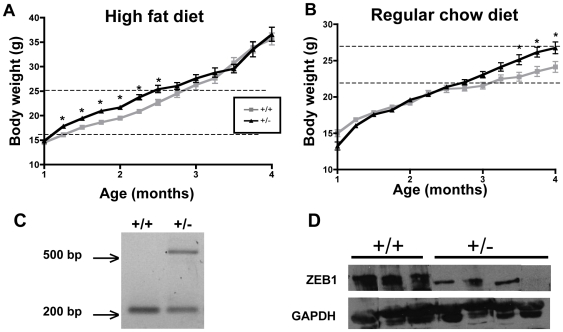
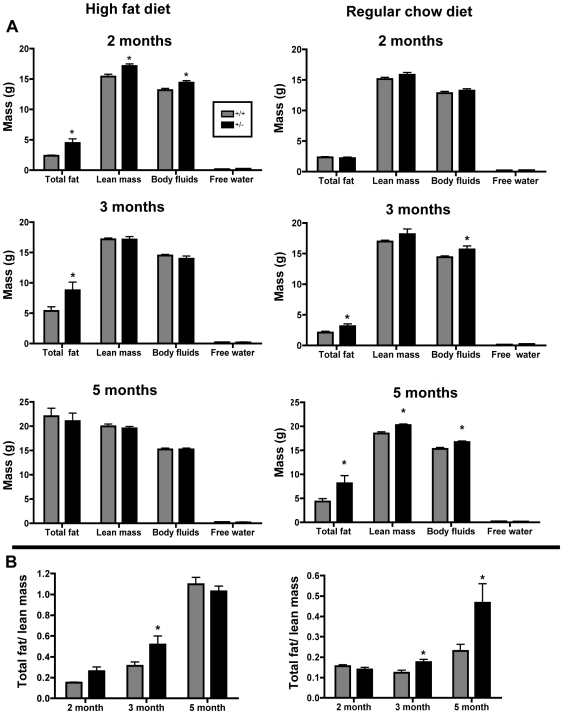
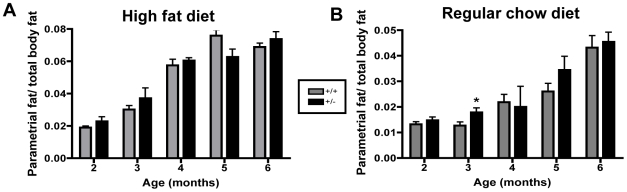
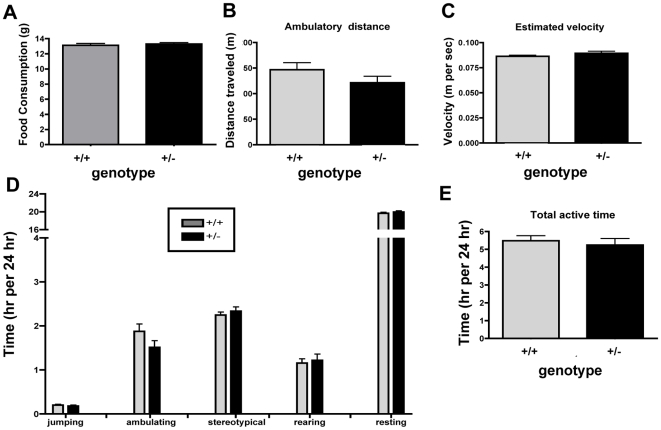
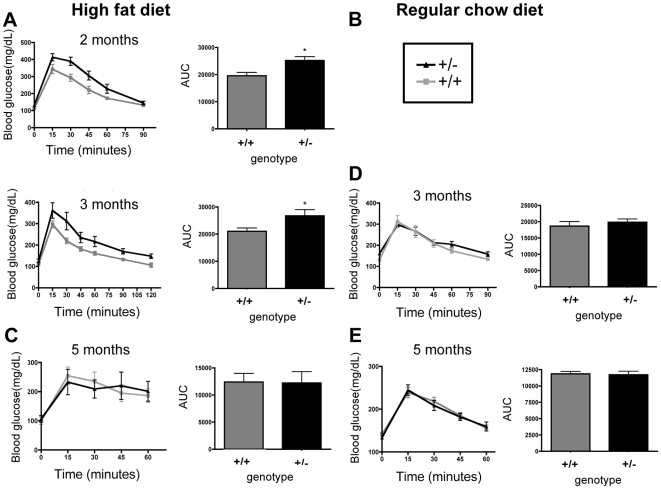
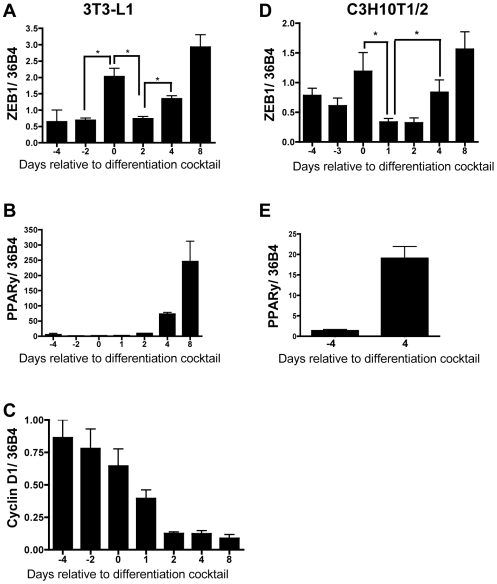
Methodology/principal findings: To ascertain whether fat accumulation affects ZEB1 expression, female C57BL/6 mice were fed a regular chow diet (RCD) ad libitum or a 25% calorie-restricted diet from 2.5 to 18.3 months of age. ZEB1 mRNA levels in parametrial fat were six to ten times higher in the obese mice. To determine directly whether ZEB1 affects adiposity, wild type (WT) mice and mice heterozygous for TCF8 (TCF8+/-) were fed an RCD or a high-fat diet (HFD) (60% calories from fat). By two months of age on an HFD and three months on an RCD, TCF8+/- mice were heavier than WT controls, which was attributed by Echo MRI to increased fat mass (at three months on an HFD: 0.517+/-0.081 total fat/lean mass versus 0.313+/-0.036; at three months on an RCD: 0.175+/-0.013 versus 0.124+/-0.012). No differences were observed in food uptake or physical activity, suggesting that the genotypes differ in some aspect of their metabolic activity. ZEB1 expression also increases during adipogenesis in cell culture.

Conclusion/significance: These results show for the first time that the ZEB1 transcription factor regulates the accumulation of adipose tissue. Furthermore, they corroborate the genome-wide association studies that mapped an "obesity" gene at chromosome 10p11-12.


Conflict of interest statement

Competing Interests: The authors have declared that no competing interests exist.

Figures

Figure 1
Figure 1. ZEB1 mRNA expression increases concomitantly with weight in WT female mice.
Mice were fed regular chow ad libitum or a diet restricted to 75% of the calories of the ad libitum group (calorie restricted). (A) Body weights (g) were recorded as indicated for mice that were fed ad libitum (gray line) or calorie restricted (black line). n = 3–7 mice/group. (B) Corresponding ZEB1 mRNA expression in parametrial fat was determined by quantitative SYBR real time PCR. ZEB1 mRNA was expressed relative to β-actin mRNA, ad libitum (gray bars), calorie restricted (black bars). n = 3–7 mice/group (C) Western blot confirming that ZEB1 protein expression increases in response to increased body weight in mice fed ad libitum. GAPDH was used as a loading control. Individual lanes are labeled as months of age.
Figure 2
Figure 2. Female mice missing one TCF8 allele gain weight more readily.
Mice were weaned to (A) a diet high in fat (60%) or (B) regular chow diet, and body weights (g) of female TCF8 +/− (black line) or WT (gray line) mice were recorded weekly as indicated. n = 8–34 mice per group, with the number of mice decreasing due to sacrifices at 2 and 3 months. (A) Significance calculated by Student's t-test between age-matched groups, using the Bonferroni post-test correction set at p<0.005. (B) Significance calculated by Student t-test between age-matched groups. All mice from 12–18 weeks have p<0.05. However, when corrected for Bonferroni's post-test at p = 0.003 only those from 14–16 weeks are significant. Significance is denoted by *. (C) An example of the genotyping that was done to identify TCF8+/− and WT mice. The band at ∼500 bp is from the β-galactosidase gene, which was inserted in one of the TCF8 alleles. The band at ∼200 bp represents TCF8. (D) ZEB1 protein levels in parametrial adipose tissue of WT (n = 3) and TCF8+/− (n = 4) female mice at 3 months of age. GAPDH was used as a loading control.
Figure 3
Figure 3. Female TCF8+/− mice fed a high-fat or regular chow diet have increased adipose mass early in fat acquisition.
Echo MRI analysis of (A) whole body composition at 2, 3, and 5 months of age and (B) the fat/lean mass ratio of TCF8+/− (black bars) or WT (gray bars) of mice fed a high fat diet (left panel) or regular chow diet (right panel). Note the difference in the y-axes for (B). n = 4–8 mice per group. Only 4 mice were available for the 2 month-old group on the high fat diet.
Figure 4
Figure 4. The mass of parametrial fat pads does not differ with genotype.
The mass of parametrial fat pads for TCF8+/− (black bars) and WT controls (gray bars) ages 2–6 months for mice fed (A) a high fat diet or (B) regular chow was determined by weighing. Note differences in the y-axes. Data are represented as a ratio of parametrial fat weight to total body weight. n = 5–12.
Figure 5
Figure 5. Increased fat accumulation is not the result of increased food consumption or decreased physical activity.
(A) Food intake was measured for 72 hours in 2.5-month-old TCF8+/− and WT mice fed regular chow. n = 10 mice per group. (B) The total distance the mice moved. (C) The estimated velocity at which the mice moved. (D) The duration of each activity or time spent resting. (E) Total duration the mice spent performing any activity. TCF8+/− mice are depicted by black bars and WT controls by gray bars. n =  15–17 mice per group for B–E. No significance differences were found for time spent on any activity, resting, total activity, estimated velocity, or number of times an activity was performed.
Figure 6
Figure 6. Female TCF8+/− mice exhibit impaired glucose uptake early in fat acquisition.
Mice were fed a high fat diet (A–C) or regular chow (D, E) until they were 2, 3, or 5 months of age. Blood glucose was measured at the indicated times following injection of glucose at 2 mg/kg (A, B, E), 0.5 mg/kg (C), or 3 mg/kg (D). Area under the curve (AUC) was calculated and graphed as histograms. When Student's t-test was used to analyze the AUC, the TCF8+/− mice were significantly different from WT in their ability to manage blood glucose levels as indicated by the asterisks. ANCOVA was performed for A and B with body fat as a co-variate for the differences in glucose tolerance between genotype to assess whether genotype contributed independently of fat mass. For A: genotype p = 0.006, body fat p = not significant, for B: genotype: p =  not significant, body fat p =  not significant. TCF8 +/− (black line) or WT (gray line), n = 5–8 mice per group.
Figure 7
Figure 7. ZEB1 expression changes similarly in two models of adipogenesis in cell culture.
3T3-L1 cells (left panels) were differentiated from pre-adipocytes into mature adipocytes. Cells reached confluency at Day -2 and were treated with a differentiation cocktail on Day 0. RNA was harvested in triplicate on the days indicated, and mRNA expression were measured by qPCR for ZEB1 (A), PPARγ (B), and Cyclin D1 (C). C3H10T1/2 pluripotent mesenchymal stem cells (right panels) were committed to the pre-adipocyte lineage by treatment with BMP-4 at Day -4, when they were 75% confluent. Cells reached confluency at Day -2 and were treated with differentiation cocktail on Day 0. RNA was harvested in triplicate at the days indicated and subjected to qPCR for ZEB1 (D) and PPARγ (E). All mRNA levels were normalized to ribosomal protein 36B4. These experiments are representative of differentiations done 5 and 6 times, respectively.

Similar articles

Cited by

References

    1. Sabin MA, Shield JP. Childhood obesity. Front Horm Res. 2008;36:85–96. - PubMed
    1. Sekiya I, Larson BL, Vuoristo JT, Cui JG, Prockop DJ. Adipogenic differentiation of human adult stem cells from bone marrow stroma (MSCs). J Bone Miner Res. 2004;19:256–64. - PubMed
    1. Gesta S, Tseng YH, Kahn CR. Developmental origin of fat: tracking obesity to its source. Cell. 2007;131:242–56. - PubMed
    1. Tontonoz P, Spiegelman BM. Fat and beyond: the diverse biology of PPARgamma. Annu Rev Biochem. 2008;77:289–312. - PubMed
    1. Xu Z, Yu S, Hsu CH, Eguchi J, Rosen ED. The orphan nuclear receptor chicken ovalbumin upstream promoter-transcription factor II is a critical regulator of adipogenesis. Proc Natl Acad Sci U S A. 2008;105:2421–6. - PMC - PubMed

Publication types

MeSH terms