. 2009 Dec 29;4(12):e8472.
doi: 10.1371/journal.pone.0008472.

MEF2C silencing attenuates load-induced left ventricular hypertrophy by modulating mTOR/S6K pathway in mice

Affiliations

MEF2C silencing attenuates load-induced left ventricular hypertrophy by modulating mTOR/S6K pathway in mice

Ana Helena M Pereira et al. PLoS One. .

Erratum in

  • PLoS One. 2014;9(10):e112344

Abstract

Background: The activation of the members of the myocyte enhancer factor-2 family (MEF2A, B, C and D) of transcription factors promotes cardiac hypertrophy and failure. However, the role of its individual components in the pathogenesis of cardiac hypertrophy remains unclear.

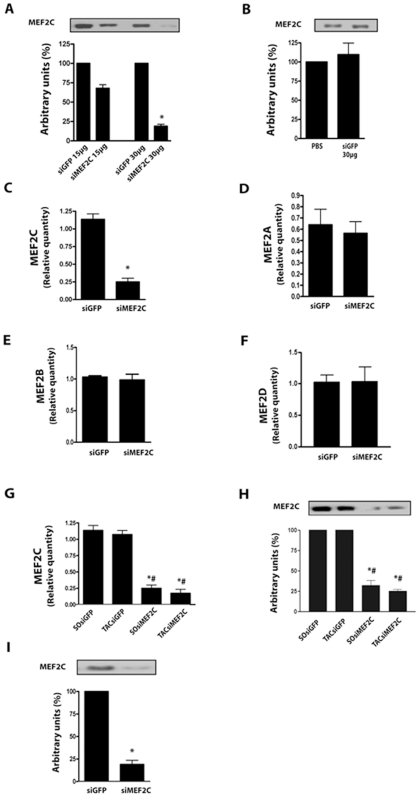
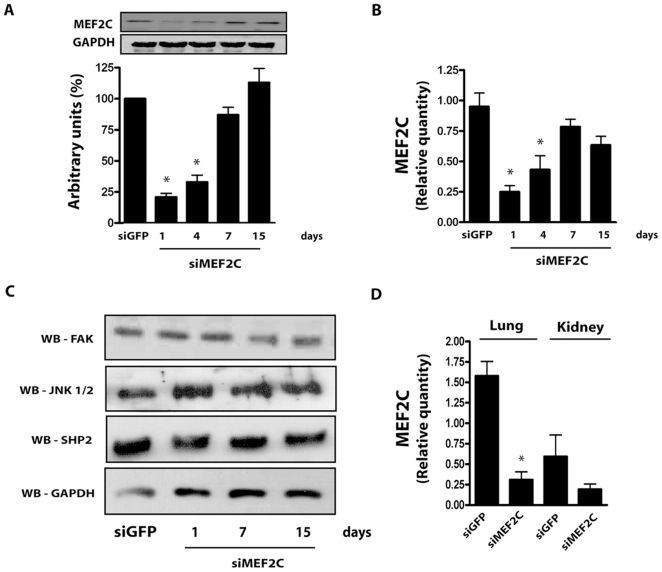
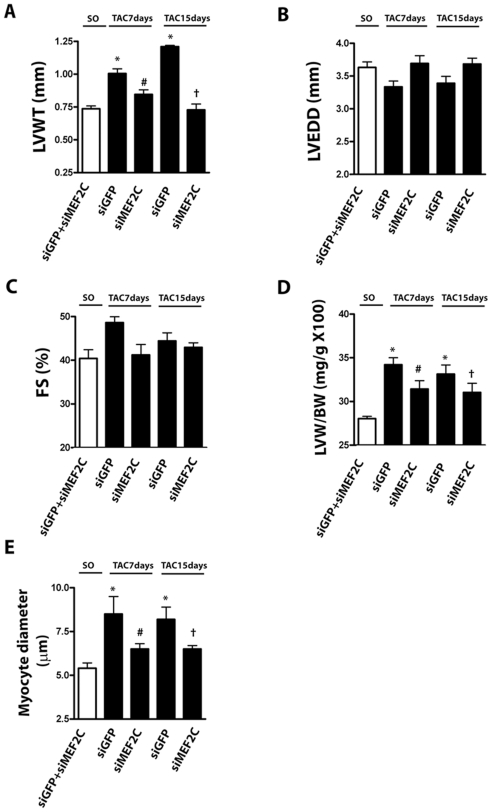
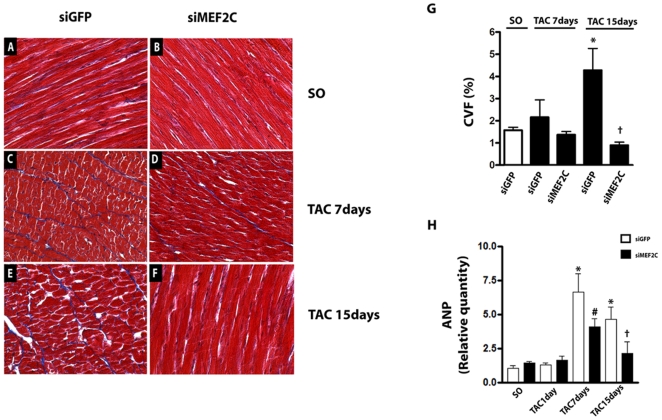
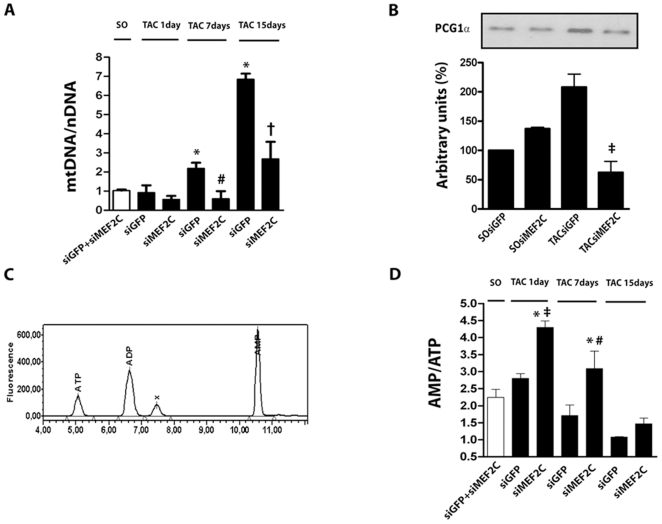
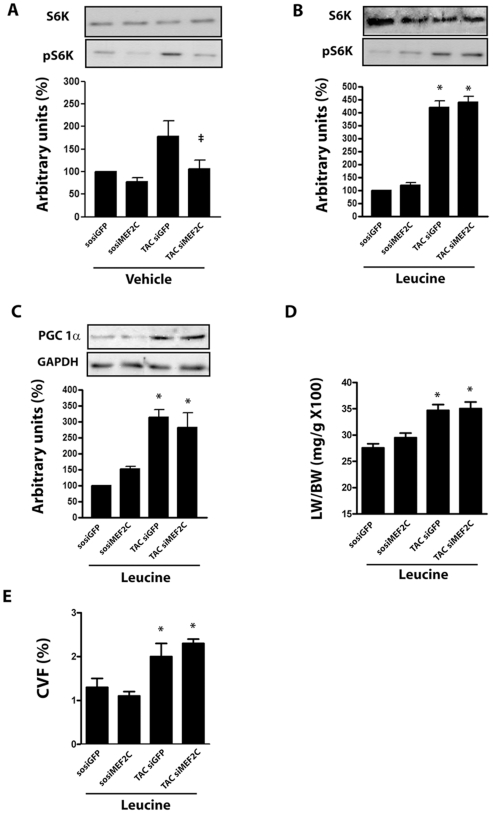
Methodology/principal findings: In this study, we investigated whether MEF2C plays a role in mediating the left ventricular hypertrophy by pressure overload in mice. The knockdown of myocardial MEF2C induced by specific small interfering RNA (siRNA) has been shown to attenuate hypertrophy, interstitial fibrosis and the rise of ANP levels in aortic banded mice. We detected that the depletion of MEF2C also results in lowered levels of both PGC-1alpha and mitochondrial DNA in the overloaded left ventricle, associated with enhanced AMP:ATP ratio. Additionally, MEF2C depletion was accompanied by defective activation of S6K in response to pressure overload. Treatment with the amino acid leucine stimulated S6K and suppressed the attenuation of left ventricular hypertrophy and fibrosis in the aforementioned aortic banded mice.

Conclusion/significance: These findings represent new evidences that MEF2C depletion attenuates the hypertrophic responses to mechanical stress and highlight the potential of MEF2C to be a target for new therapies to cardiac hypertrophy and failure.


Conflict of interest statement

Competing Interests: The authors have declared that no competing interests exist.

Figures

Figure 1
Figure 1. MEF2C silencing in NRVMs culture.
(A) Bar graph shows relative quantity (RQ) of MEF2C in respect to GAPDH transcripts as a percentage of calibrator sample (siGFP) obtained by real time-PCR. (B) Bar graph shows the RQ of MEF2A transcripts. (C) Bar graph shows the RQ of MEF2B transcripts. (D) Bar graph shows the RQ of MEF2D transcripts. (E) MEF2C protein expression (n = 3 cultures). (F), MEF2A protein expression. * p<0.05 vs treatment with siGFP. These data are from 3 NRVMs culture at least.
Figure 2
Figure 2. Optimization of MEF2C silencing in mice left ventricle.
(A) MEF2C protein expression from assays with increasing amounts of siMEF2C or siGFP, via the jugular vein. (B) Myocardial expression of MEF2C from mice treated with siGFP and phosphate buffer saline (PBS). (C) Relative quantity (RQ) of MEF2C, (D) MEF2A and (E) MEF2B transcripts in mice treated with 30 µg of siMEF2C or siGFP. (F) MEF2D transcripts in mice treated with siMEF2C or siGFP. (G) Bar graphs show RQ of MEF2C transcript and (H) MEF2C protein expression in the left ventricle of aortic banded (TAC) and sham-operated (SO) mice. (I) MEF2C protein expression in adult cardiomyocytes harvested from mice left ventricle 24 hours after siRNA treatment. * p<0.05 vs SOsiGFP; # p<0.05 vs TACsiGFP. At least 6 animals were analyzed in these experiments.
Figure 3
Figure 3. Effects of siMEF2C in distinct tissues and signaling proteins.
(A) Time-course of MEF2C protein expression and (B) transcript levels normalized by GAPDH. (C) Myocardial expression of FAK, JNK, SHP2 and GAPDH. (D) Relative quantity of MEF2C transcripts in mice lung and kidney. * p<0.05 vs treatment with siGFP. At least 5 mice were employed for each subgroup.
Figure 4
Figure 4. MEF2C silencing prevents load-induced left ventricular hypertrophy.
Data from sham operated (SO) and aortic banded mice (7 to 15 days after transverse aortic constriction – TAC). Bar graphs indicating the echocardiographic values of (A) posterior wall thickness (LVWT), (B) diastolic diameter (LVEDD) and (C) fractional shortening (FS). The values of SO mice treated with siMEF2C or siGFP did not reach statistical significance, so they were averaged. (D) Bar graphs show the left ventricle mass/body mass ratio and (E) the average cardiomyocytes diameter. * p<0.05 vs SO; # p<0.05 vs TAC 7days siGFP; † p<0,05 vs TAC 15 days siGFP. A total of 9 mice were analyzed in each subgroup.
Figure 5
Figure 5. MEF2C silencing prevents the myocardial deleterious effects of pressure overload.
Myocardial samples of SO and TAC mice treated with siMEF2C or siGFP stained with Masson trichrome (X400): (A) - SO- siGFP, (B) – SO- siMEF2C, (C) – TAC(7days)- SO- siGFP, (D) - TAC(7days)- siMEF2C, (E) - TAC(15days)- SO- siGFP, (F) - TAC(15days)- siMEF2C. (G) Bar graph indicates the average fraction volume of collagen (CVF%) (n = 9 mice each subgroup). (H) Relative quantity (RQ) of ANP transcript (n = 9 mice each subgroup). * p<0.05 compared with values of SO mice; # p<0.05 compared with values of TAC 7days siGFP mice, † p<0,05 compared to values of TAC 15days siGFP mice.
Figure 6
Figure 6. MEF2C silencing negatively regulates myocardial mitochondriogenesis.
(A) Bar graph shows relative quantity (RQ) of mtDNA (mt - mitochondrial) to nDNA (n – nuclear). (B) PGC-1α protein expression. (C) Representative chromatogram of AMP, ADP and ATP detection peaks. (D) Bar graph indicates the average values of the AMP:ATP ratio. The data were from left ventricle of SO and TAC (1 day) mice treated with siMEF2C or siGFP (n = 9 mice each subgroup).* p<0.05 compared with values of SO mice; ‡ p<0.05 compared with values of TAC 1day siGFP mice; # p<0.05 compared with values of TAC 7days siGFP mice; † p<0.05 compared with values of TAC 15days siGFP mice.
Figure 7
Figure 7. MEF2C depletion attenuates hypertrophy by modulating mTOR/S6K pathway.
(A) S6K and phosphoS6K (p-S6K) protein expression in the left ventricle of SO and TAC (1 day) mice treated with siMEF2C or siGFP (n = 6 mice each subgroup). From samples of left ventricle of SO and TAC (7 days) mice treated with siMEF2C or siGFP and leucine (n = 9 mice each subgroup) were measured: (B) S6K, phosphoS6K (p-S6K) and (C) PGC-1α protein levels, (D) the left ventricle mass/body mass ratio mice and (E) the average fraction volume of collagen (CVF%). * p<0.05 compared with values of SO mice.

Similar articles

Cited by

References

    1. Katz AM. The cardiomyopathy of overload: an unnatural growth response in the hypertrophied heart. Ann Intern Med. 1994;121:363–371. - PubMed
    1. Opie LH, Commerford PJ, Gersh BJ, Pfeffer MA. Controversies in ventricular remodelling. Lancet. 2006;367:356–367. - PubMed
    1. Vakili BA, Okin PM, Devereux RB. Prognostic implications of left ventricular hypertrophy. Am Heart J. 2001;141:334–341. - PubMed
    1. Diwan A, Dorn GW., 2nd Decompensation of cardiac hypertrophy: cellular mechanisms and novel therapeutic targets. Physiology (Bethesda) 2007;22:56–64. - PubMed
    1. Chien KR. Stress pathways and heart failure. Cell. 1999;98:555–558. - PubMed

Publication types

MeSH terms