. 2009 Dec 29;4(12):e8474.
doi: 10.1371/journal.pone.0008474.

Anti-dsDNA antibodies promote initiation, and acquired loss of renal Dnase1 promotes progression of lupus nephritis in autoimmune (NZBxNZW)F1 mice

Affiliations

Anti-dsDNA antibodies promote initiation, and acquired loss of renal Dnase1 promotes progression of lupus nephritis in autoimmune (NZBxNZW)F1 mice

Kristin Fenton et al. PLoS One. .

Abstract

Background: Lupus nephritis is characterized by deposition of chromatin fragment-IgG complexes in the mesangial matrix and glomerular basement membranes (GBM). The latter defines end-stage disease. METHODOLOGY/PRINCIPALS: In the present study we determined the impact of antibodies to dsDNA, renal Dnase1 and matrix metalloprotease (MMP) mRNA levels and enzyme activities on early and late events in murine lupus nephritis. The major focus was to analyse if these factors were interrelated, and if changes in their expression explain basic processes accounting for lupus nephritis.

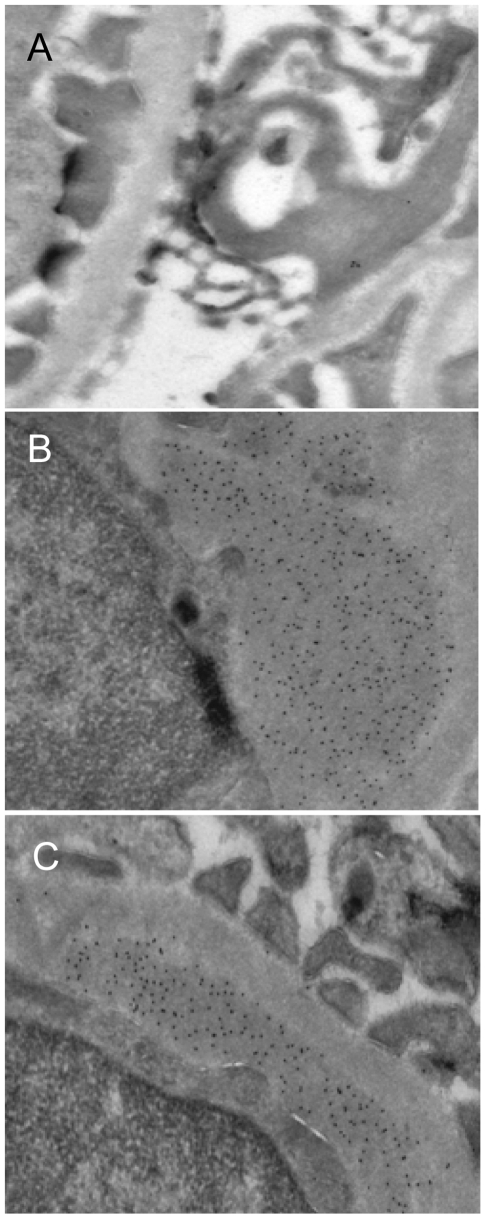
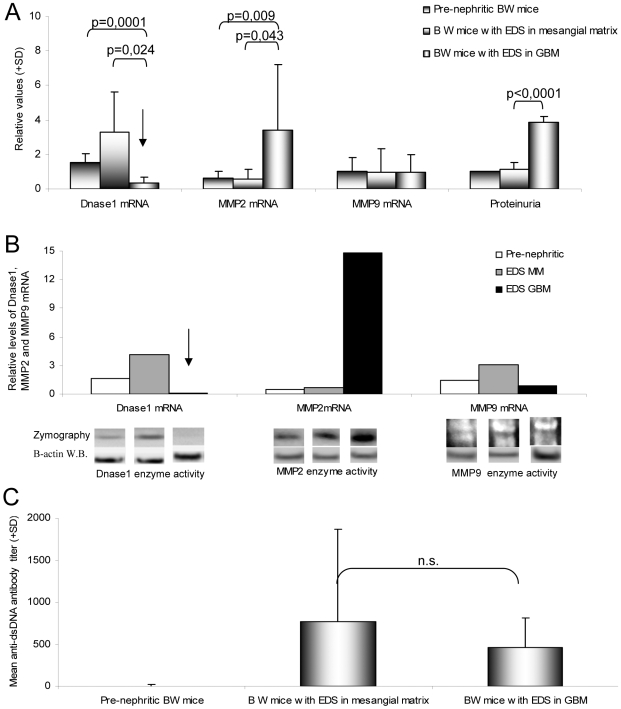
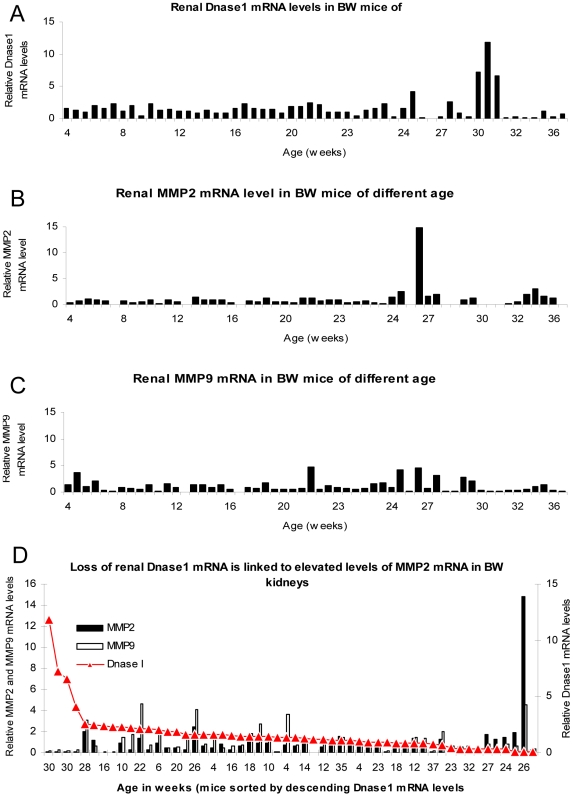
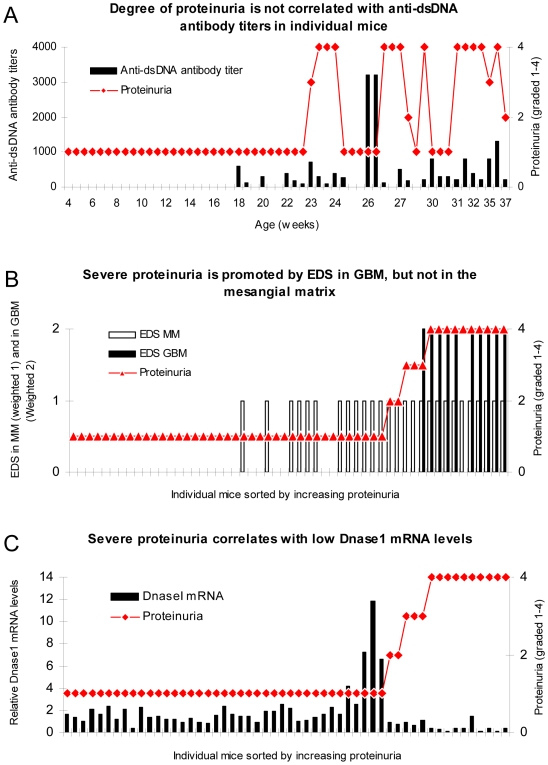
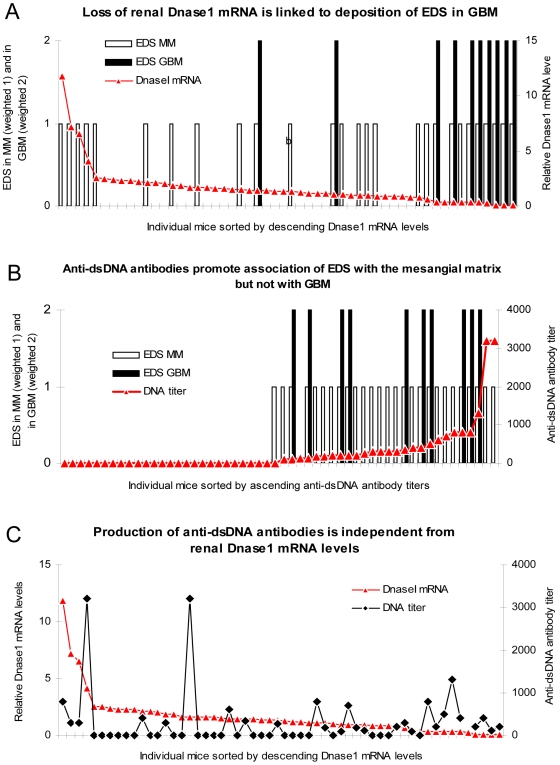
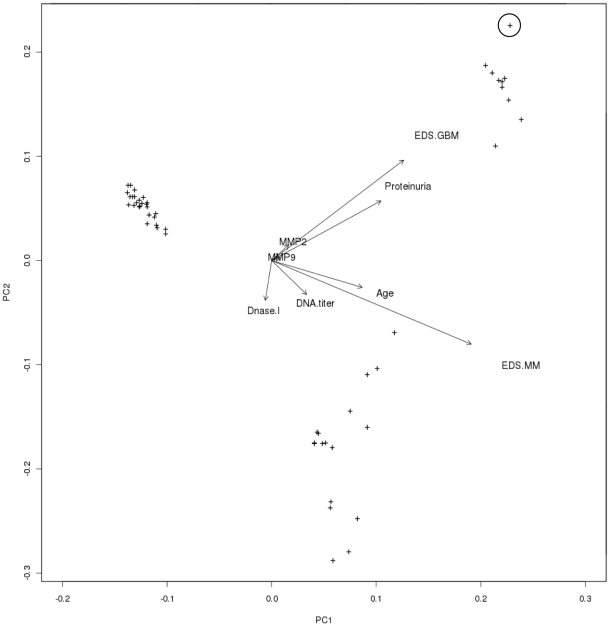
Findings: Early phases of nephritis were associated with chromatin-IgG complex deposition in the mesangial matrix. A striking observation was that this event correlated with appearance of anti-dsDNA antibodies and mild or clinically silent nephritis. These events preceded down-regulation of renal Dnase1. Later, renal Dnase1 mRNA level and enzyme activity were reduced, while MMP2 mRNA level and enzyme activity increased. Reduced levels of renal Dnase1 were associated in time with deficient fragmentation of chromatin from dead cells. Large fragments were retained and accumulated in GBM. Also, since chromatin fragments are prone to stimulate Toll-like receptors in e.g. dendritic cells, this may in fact explain increased expression of MMPs.

Significance: These scenarios may explain the basis for deposition of chromatin-IgG complexes in glomeruli in early and late stages of nephritis, loss of glomerular integrity and finally renal failure.


Conflict of interest statement

Competing Interests: The authors have declared that no competing interests exist.

Figures

Figure 1
Figure 1. (NZBxNZW)F1 mice grouped according to glomerular location of EDS deposits.
(NZBxNZW)F1 mice were sacrificed approximately every second week (in sets of 3) until development of end-stage lupus-like nephritis. The mice were sorted into 3 main groups according to kidney morphology; pre-nephritic mice (Group 1, no glomerular deposits of EDS (n = 27), A), mice with mesangial EDS deposits (Group 2 (n = 17), B), or mice with EDS deposits in GBM (Group 3 (n = 10), C). Magnification×40 k.
Figure 2
Figure 2. Levels of Dnase1, MMP2 and MMP9 mRNA and enzyme activities, and mean anti-dsDNA antibody titers in Group 1–Group 3 mice.
There were no significant differences with respect to Dnase1, MMP2 or MMP9 mRNA levels and degree of proteinuria between Group 1 and Group 2 mice (A). In Group 3 mice, Dnase1 mRNA levels were severely and significantly down-regulated, while MMP2 mRNA levels and proteinuria were significantly higher than in the former 2 groups of BW mice (A). The variations in mRNA levels were reflected in a similar variation in enzyme activities, as demonstrated in individual mice by relevant zymography analyses (exemplified in B, see also [29]). The results in A and B indicate that low Dnase1, high MMP2 and severe proteinuria may be interdependent parameters. Mean anti-dsDNA antibody titers were lower in Group 3 mice, compared with mice in Group 2, although the difference was not statistically significant (C). Arrows in A and B point at reduced Dnase1 mRNA levels. Results are given as mean (±SD) and an unpaired t test was performed to determine differences between each group for each parameter. A one-way ANOVA was performed to compare all groups for each parameter. n.s.: not significant.
Figure 3
Figure 3. Dnase1, MMP2 and MMP9 mRNA levels and their correlations in mice of different age.
Dnase1 mRNA levels fluctuated over the entire observation time (A). Similarly, both MMP2 and MMP9 showed a considerable variability with some peaks in mice of higher age (B and C, for MMP2 and MMP9, respectively). To analyse if levels of Dnase1, MMP2 and MMP9 mRNA correlated with each other, the data were combined for each mouse, and this set of data was sorted by descending Dnase1 mRNA levels. As demonstrated in panel D, very low levels of Dnase1 were inversely correlated with high levels of MMP2 (correlation coefficient −0,299, p = 0,016). This indicates that there is a link between loss of Dnase1 and up-regulation of MMP2. Chromatin fragments that are not appropriately fragmented and cleared may be the common denominator (see text for details).
Figure 4
Figure 4. Severe proteinuria correlates with EDS deposits in GBM, and inversely with renal Dnase1 mRNA levels.
In mice sorted for age, there was no association between degree of proteinuria and levels of anti-dsDNA antibody titers (A). To analyse if location of EDS deposits had impact on proteinuria, data on proteinuria and deposition of EDS in the mesangial matrix (weighted 1 in B) or in the GBM (weighted 2 to make a visual distinction from deposits in the mesangial matrix) were combined for each mouse, and sorted by ascending values of proteinuria. Severe proteinuria (≥20 g/L) was, except for one mouse with intermediate proteinuria (≤3 g/L), exclusively observed in mice with EDS in GBM (B), while intermediate or mild proteinuria was observed in only 4 out of 17 mice with mesangial matrix deposits (B). In panel C, degree of proteinuria and renal Dnase1 mRNA levels were paired and sorted by ascending proteinuria. Severe proteinuria (≥20 g/L) correlated with a substantial loss of Dnase1 mRNA (and enzyme activity, see Figure 2). Thus, in mice selected for proteinuria ≥20 g/L, renal Dnase1 mRNA was nearby lost in all but one mouse (C), and deposits of chromatin-IgG complexes (observed as EDS) in GBM were observed only in these mice. For statistics, see Table 1.
Figure 5
Figure 5. Anti-dsDNA antibodies and renal Dnase1 levels, and their correlation with EDS in mesangial matrix and GBM, respectively.
Data on Dnase1 mRNA levels and EDS in the mesangial matrix (weighted 1 in Figure 5A and B), or in GBM (weighted 2) where combined for each mouse and sorted by descending Dnase1 mRNA levels. The result of this analysis demonstrates a clear negative correlation between Dnase1 mRNA levels and presence of EDS in GBM. This association was statistically highly significant (A, see Table 1 for statistical analyses). The inverse correlation of EDS in the mesangial matrix with Dnase1 mRNA levels was weaker, and did not reach statistical significance (A, Table 1). The presence of EDS solely in the mesangial matrix was significantly associated with production of anti-dsDNA antibodies (B, Table 1). This demonstrates that deposition of EDS in the mesangial matrix and in the GBM may originate from different molecular processes; EDS in mesangial matrix depend on presence of antibodies to dsDNA, while EDS in GBM depend on reduced renal Dnase1 activity. Production and titers of antibodies to dsDNA was not significantly associated with levels of renal. Dnase1 mRNA and enzyme activities (C, Table 1).
Figure 6
Figure 6. A principal component analysis (PCA) of parameters included in this study.
This PCA biplot aims to optimally display variances and not correlations. The angles between the various biplot axes serve as good indicators of the correlations among the variables (shown as arrows). Similarly, the position of the samples of individual mice (shown as plus signs) relative to the arrows, provide good indications as to which variable(s) have had the largest effect. The result of the biplot demonstrates that groups emerging from this analysis perfectly correlated with the groups of BW mice as defined in Figure 1 and Figure 2, defined as pre-nephritic BW mice (Group 1), BW mice with deposits of EDS in the mesangial matrix (Group 2) or with deposits in the GBM (Group 3). The circle identifies the mouse with the lowest renal Dnase1 mRNA level and enzyme activity, and the highest MMP2 and MMP9 mRNA levels and enzyme activities and with proteinuria ≥20 g/L.

Similar articles

Cited by

References

    1. Tan EM, Cohen AS, Fries JF, Masi AT, McShane DJ, et al. The 1982 revised criteria for the classification of systemic lupus erythematosus. Arthritis Rheum. 1982;25:1271–1277. - PubMed
    1. Qureshi F, Yang Y, Jaques SM, Johnson MP, Naparstek Y, et al. Anti-DNA antibodies cross-reacting with laminin inhibit trophoblast attachment and migration: implications for recurrent pregnancy loss in SLE patients. Am J Reprod Immunol. 2000;44:136–142. - PubMed
    1. Sabbaga J, Line SR, Potocnjak P, Madaio MP. A murine nephritogenic monoclonal anti-DNA autoantibody binds directly to mouse laminin, the major non-collagenous protein component of the glomerular basement membrane. Eur J Immunol. 1989;19:137–143. - PubMed
    1. Amital H, Heilweil M, Ulmansky R, Szafer F, Bar-Tana R, et al. Treatment with a laminin-derived peptide suppresses lupus nephritis. J Immunol. 2005;175:5516–5523. - PubMed
    1. Mostoslavsky G, Fischel R, Yachimovich N, Yarkoni Y, Rosenmann E, et al. Lupus anti-DNA autoantibodies cross-react with a glomerular structural protein: a case for tissue injury by molecular mimicry. Eur J Immunol. 2001;31:1221–1227. - PubMed

Publication types

MeSH terms