

The Bifidobacterium dentium Bd1 genome sequence reflects its genetic adaptation to the human oral cavity
- PMID: 20041198
- PMCID: PMC2788695
- DOI: 10.1371/journal.pgen.1000785
The Bifidobacterium dentium Bd1 genome sequence reflects its genetic adaptation to the human oral cavity
Abstract
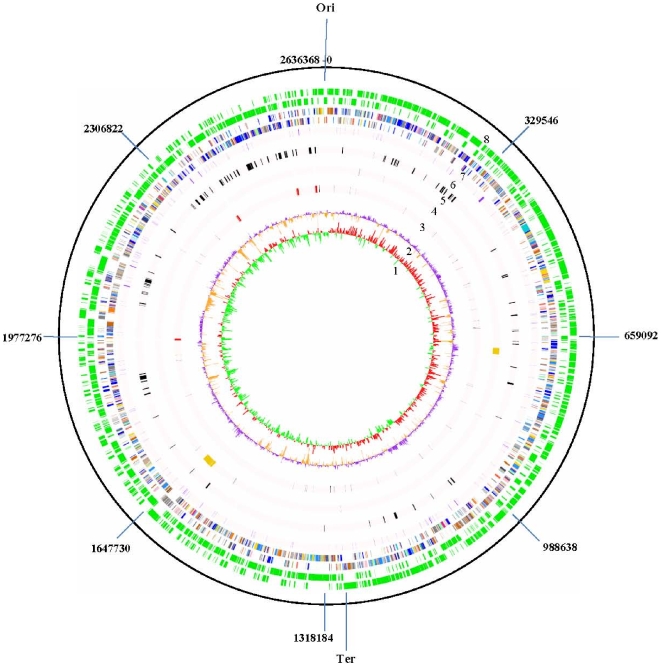
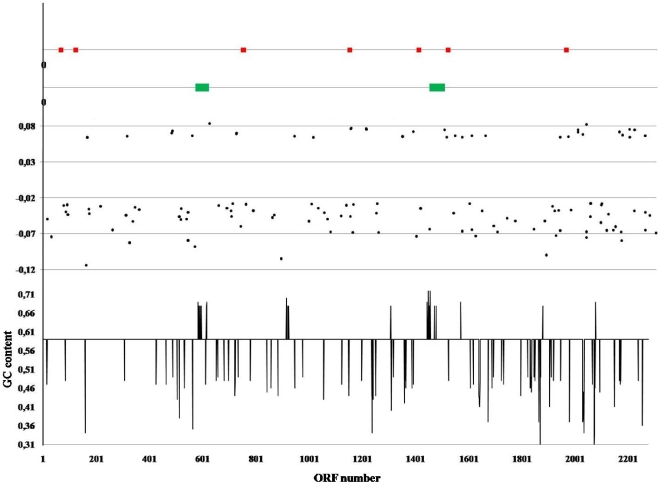
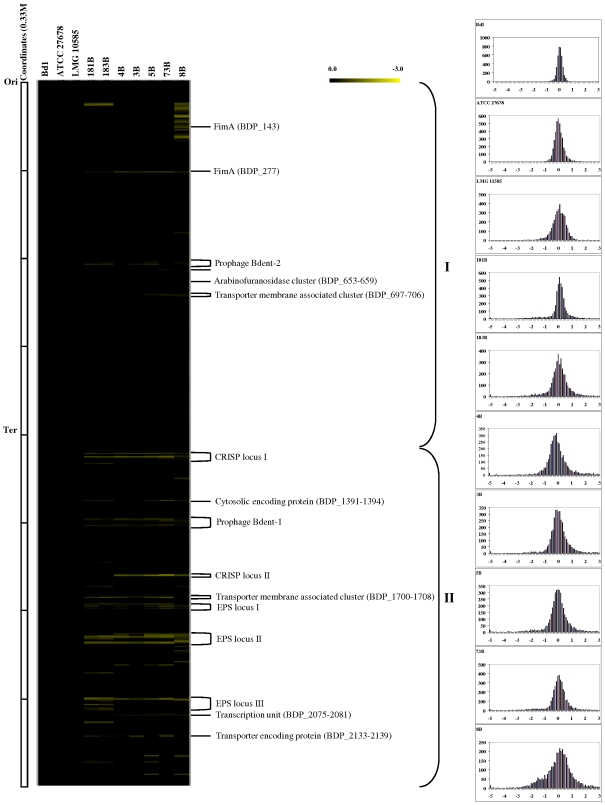
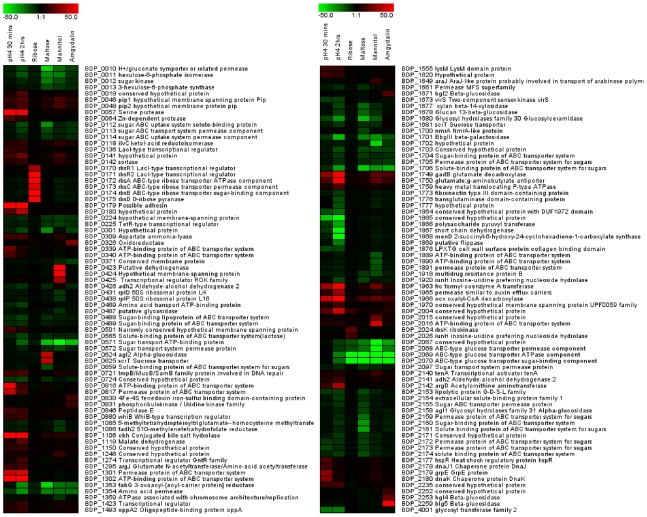
Bifidobacteria, one of the relatively dominant components of the human intestinal microbiota, are considered one of the key groups of beneficial intestinal bacteria (probiotic bacteria). However, in addition to health-promoting taxa, the genus Bifidobacterium also includes Bifidobacterium dentium, an opportunistic cariogenic pathogen. The genetic basis for the ability of B. dentium to survive in the oral cavity and contribute to caries development is not understood. The genome of B. dentium Bd1, a strain isolated from dental caries, was sequenced to completion to uncover a single circular 2,636,368 base pair chromosome with 2,143 predicted open reading frames. Annotation of the genome sequence revealed multiple ways in which B. dentium has adapted to the oral environment through specialized nutrient acquisition, defences against antimicrobials, and gene products that increase fitness and competitiveness within the oral niche. B. dentium Bd1 was shown to metabolize a wide variety of carbohydrates, consistent with genome-based predictions, while colonization and persistence factors implicated in tissue adhesion, acid tolerance, and the metabolism of human saliva-derived compounds were also identified. Global transcriptome analysis demonstrated that many of the genes encoding these predicted traits are highly expressed under relevant physiological conditions. This is the first report to identify, through various genomic approaches, specific genetic adaptations of a Bifidobacterium taxon, Bifidobacterium dentium Bd1, to a lifestyle as a cariogenic microorganism in the oral cavity. In silico analysis and comparative genomic hybridization experiments clearly reveal a high level of genome conservation among various B. dentium strains. The data indicate that the genome of this opportunistic cariogen has evolved through a very limited number of horizontal gene acquisition events, highlighting the narrow boundaries that separate commensals from opportunistic pathogens.
Conflict of interest statement
The authors have declared that no competing interests exist.
Figures
Similar articles
-
The genome sequence of Bifidobacterium longum reflects its adaptation to the human gastrointestinal tract.Proc Natl Acad Sci U S A. 2002 Oct 29;99(22):14422-7. doi: 10.1073/pnas.212527599. Epub 2002 Oct 15. Proc Natl Acad Sci U S A. 2002. PMID: 12381787 Free PMC article.
-
Gene-trait matching among Bifidobacterium dentium strains reveals various glycan metabolism loci including a strain-specific fucosyllactose utilization cluster.Front Microbiol. 2025 May 12;16:1584694. doi: 10.3389/fmicb.2025.1584694. eCollection 2025. Front Microbiol. 2025. PMID: 40421466 Free PMC article.
-
The metabolic profile of Bifidobacterium dentium reflects its status as a human gut commensal.BMC Microbiol. 2021 May 24;21(1):154. doi: 10.1186/s12866-021-02166-6. BMC Microbiol. 2021. PMID: 34030655 Free PMC article.
-
Genomics and ecological overview of the genus Bifidobacterium.Int J Food Microbiol. 2011 Sep 1;149(1):37-44. doi: 10.1016/j.ijfoodmicro.2010.12.010. Epub 2010 Dec 28. Int J Food Microbiol. 2011. PMID: 21276626 Review.
-
Exploiting Bifidobacterium genomes: the molecular basis of stress response.Int J Food Microbiol. 2007 Nov 30;120(1-2):13-24. doi: 10.1016/j.ijfoodmicro.2007.06.016. Epub 2007 Jun 14. Int J Food Microbiol. 2007. PMID: 17629583 Review.
Cited by
-
Qualitative and Semiquantitative Analysis of Fecal Bifidobacterium Species in Centenarians Living in Bama, Guangxi, China.Curr Microbiol. 2015 Jul;71(1):143-9. doi: 10.1007/s00284-015-0804-z. Epub 2015 Mar 25. Curr Microbiol. 2015. PMID: 26003628
-
Integrated genome-based assessment of safety and probiotic characteristics of Lactiplantibacillus plantarum PMO 08 isolated from kimchi.PLoS One. 2022 Oct 3;17(10):e0273986. doi: 10.1371/journal.pone.0273986. eCollection 2022. PLoS One. 2022. PMID: 36190947 Free PMC article.
-
Genome-Wide Assessment of Stress-Associated Genes in Bifidobacteria.Appl Environ Microbiol. 2022 Apr 12;88(7):e0225121. doi: 10.1128/aem.02251-21. Epub 2022 Mar 21. Appl Environ Microbiol. 2022. PMID: 35311508 Free PMC article.
-
Age-Related Changes in the Composition of Gut Bifidobacterium Species.Curr Microbiol. 2017 Aug;74(8):987-995. doi: 10.1007/s00284-017-1272-4. Epub 2017 Jun 8. Curr Microbiol. 2017. PMID: 28593350 Free PMC article.
-
Comparison of gut microbiota structure and Actinobacteria abundances in healthy young adults and elderly subjects: a pilot study.BMC Microbiol. 2021 Jan 6;21(1):13. doi: 10.1186/s12866-020-02068-z. BMC Microbiol. 2021. PMID: 33407122 Free PMC article.
References
-
- Backhed F, Ley RE, Sonnenburg JL, Peterson DA, Gordon JI. Host-bacterial mutualism in the human intestine. Science. 2005;307:1915–1920. - PubMed
-
- Guarner F, Malagelada JR. Gut flora in health and disease. Lancet. 2003;361:512–519. - PubMed
-
- Hooper LV, Wong MH, Thelin A, Hansson L, Falk PG, et al. Molecular analysis of commensal host-microbial relationships in the intestine. Science. 2001;291:881–884. - PubMed
-
- Marco ML, Pavan S, Kleerebezem M. Towards understanding molecular modes of probiotic action. Curr Opin Biotechnol. 2006;17:204–210. - PubMed
Publication types
MeSH terms
Substances
LinkOut - more resources
Full Text Sources
Molecular Biology Databases
