

Design principles for ligand-sensing, conformation-switching ribozymes
- PMID: 20041206
- PMCID: PMC2789328
- DOI: 10.1371/journal.pcbi.1000620
Design principles for ligand-sensing, conformation-switching ribozymes
Abstract
Nucleic acid sensor elements are proving increasingly useful in biotechnology and biomedical applications. A number of ligand-sensing, conformational-switching ribozymes (also known as allosteric ribozymes or aptazymes) have been generated by some combination of directed evolution or rational design. Such sensor elements typically fuse a molecular recognition domain (aptamer) with a catalytic signal generator (ribozyme). Although the rational design of aptazymes has begun to be explored, the relationships between the thermodynamics of aptazyme conformational changes and aptazyme performance in vitro and in vivo have not been examined in a quantitative framework. We have therefore developed a quantitative and predictive model for aptazymes as biosensors in vitro and as riboswitches in vivo. In the process, we have identified key relationships (or dimensionless parameters) that dictate aptazyme performance, and in consequence, established equations for precisely engineering aptazyme function. In particular, our analysis quantifies the intrinsic trade-off between ligand sensitivity and the dynamic range of activity. We were also able to determine how in vivo parameters, such as mRNA degradation rates, impact the design and function of aptazymes when used as riboswitches. Using this theoretical framework we were able to achieve quantitative agreement between our models and published data. In consequence, we are able to suggest experimental guidelines for quantitatively predicting the performance of aptazyme-based riboswitches. By identifying factors that limit the performance of previously published systems we were able to generate immediately testable hypotheses for their improvement. The robust theoretical framework and identified optimization parameters should now enable the precision design of aptazymes for biotechnological and clinical applications.
Conflict of interest statement
The authors have declared that no competing interests exist.
Figures
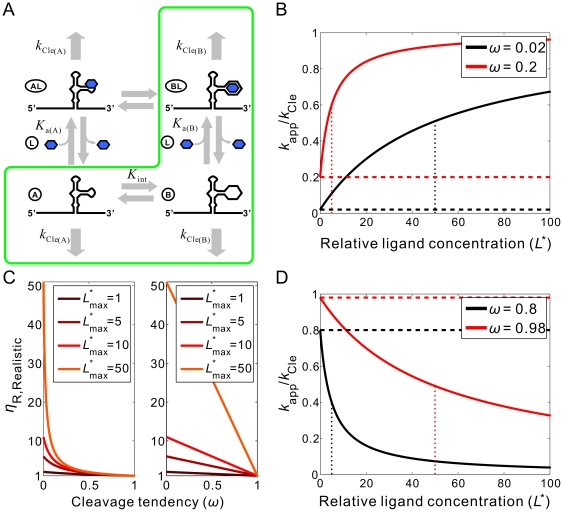
 are shown as a vertical dotted lines. (C) The relationship between the cleavage tendency (ω) of an aptazyme and the realistic ligand-dependent change in activity (
 ) is shown for ligand-activated aptazymes (left) and ligand-inhibited aptazymes (right). This relationship is shown for different maximum available ligand concentrations (
 ).
).
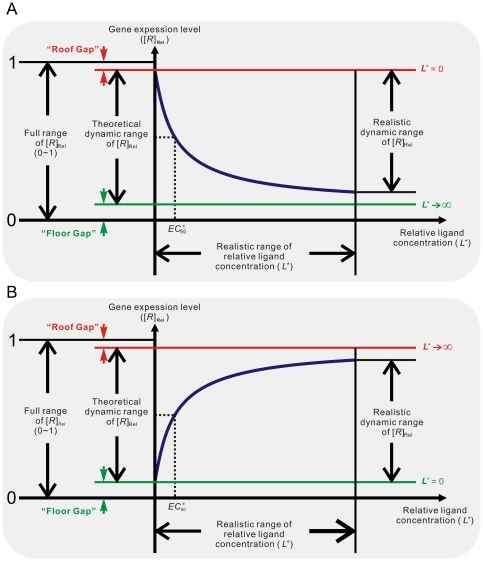
 of the aptamer) and the relative gene expression level (steady-state mRNA concentration of the aptazyme-harboring gene divided by that of the un-engineered gene) are shown on the horizontal and vertical axes, respectively.
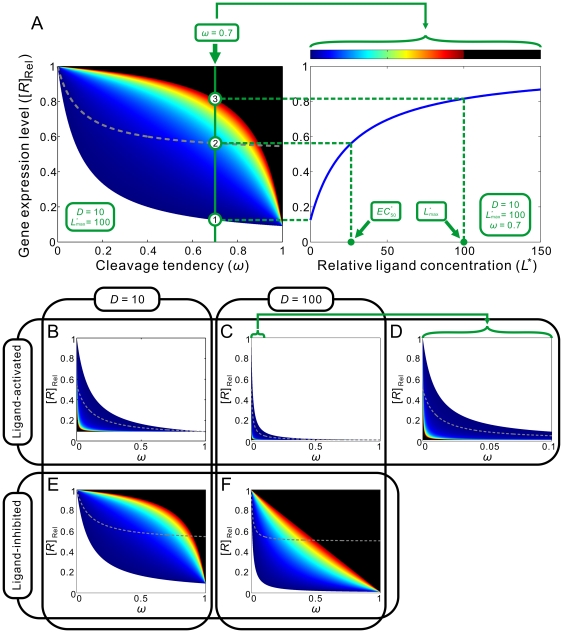
 are all known, the regulatory landscape of a given riboswitch can be determined. The left panel shows an example of a ligand-inhibited aptazyme with
  and
and  . Different cleavage tendencies (ω, horizontal axis) and relative gene expression levels (vertical axis) are related by relative ligand concentrations (indicated by color mapping; the color scale is shown on the top of the right panel). The dynamic range of activities for a given ω can be determined by drawing a vertical line and looking at the relative gene expression levels at relative ligand concentrations 0 and 100. Such a vertical line is shown for a ω of 0.7, and the dynamic range (the ratio of the values at points
  and
and  ) is ca. 6-fold. The relative concentration at point
  corresponds to the
  of this riboswitch. The dashed gray line represents the span of relative EC
50 (
of this riboswitch. The dashed gray line represents the span of relative EC
50 ( ) values. (B to D) The regulatory landscapes of ligand-activated aptazymes with different D values ( = 10 and 100) but the same
  value ( = 100). Note that panel D is an expanded view of panel C where ω varies from 0 to 0.1 (instead of 0 to 1). (E to F) The regulatory landscapes of ligand-inhibited aptazymes with different D values ( = 10 and 100) but the same
  value ( = 100).
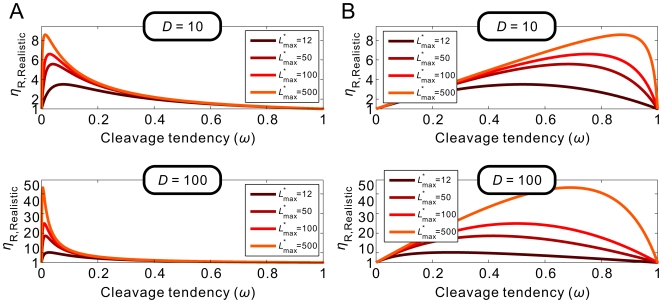
 is defined as fold-inhibition and fold-activation of gene expression across the realistic dynamic range of gene expression. The relationship between
  and cleavage tendency ω is shown for different, maximum possible relative ligand concentrations (
 ; shown in different colors).
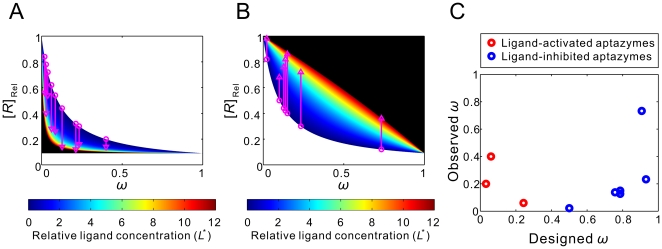
 is 12. The published relative expression levels of the designed aptazymes in the absence of ligand (pink circles) and at saturating concentrations of ligand (pink triangles) are plotted versus the calculated cleavage tendency [using equations (25) and (35)]. (C) The discrepancy between designed cleavage tendencies (see Methods) and observed cleavage tendencies (
Table 1
).
is 12. The published relative expression levels of the designed aptazymes in the absence of ligand (pink circles) and at saturating concentrations of ligand (pink triangles) are plotted versus the calculated cleavage tendency [using equations (25) and (35)]. (C) The discrepancy between designed cleavage tendencies (see Methods) and observed cleavage tendencies (
Table 1
).Similar articles
-
Leakage and slow allostery limit performance of single drug-sensing aptazyme molecules based on the hammerhead ribozyme.RNA. 2009 Jan;15(1):76-84. doi: 10.1261/rna.1346609. Epub 2008 Nov 24. RNA. 2009. PMID: 19029309 Free PMC article.
-
Deep Sequencing Analysis of Aptazyme Variants Based on a Pistol Ribozyme.ACS Synth Biol. 2017 Jul 21;6(7):1283-1288. doi: 10.1021/acssynbio.7b00057. Epub 2017 Apr 14. ACS Synth Biol. 2017. PMID: 28398719
-
Aptazymes: Expanding the Specificity of Natural Catalytic Nucleic Acids by Application of In Vitro Selected Oligonucleotides.Adv Biochem Eng Biotechnol. 2020;170:107-119. doi: 10.1007/10_2019_92. Adv Biochem Eng Biotechnol. 2020. PMID: 30847536 Review.
-
Circularly-Permuted Pistol Ribozyme: A Synthetic Ribozyme Scaffold for Mammalian Riboswitches.ACS Synth Biol. 2021 Aug 20;10(8):2040-2048. doi: 10.1021/acssynbio.1c00213. Epub 2021 Aug 10. ACS Synth Biol. 2021. PMID: 34374523
-
Engineering of ribozyme-based riboswitches for mammalian cells.Methods. 2012 Mar;56(3):351-7. doi: 10.1016/j.ymeth.2012.01.005. Epub 2012 Jan 28. Methods. 2012. PMID: 22305857 Review.
Cited by
-
Exploring the Dynamics and Mutational Landscape of Riboregulation with a Minimal Synthetic Circuit in Living Cells.Biophys J. 2015 Sep 1;109(5):1070-6. doi: 10.1016/j.bpj.2015.07.021. Biophys J. 2015. PMID: 26331264 Free PMC article.
-
Methods and Applications of In Silico Aptamer Design and Modeling.Int J Mol Sci. 2020 Nov 10;21(22):8420. doi: 10.3390/ijms21228420. Int J Mol Sci. 2020. PMID: 33182550 Free PMC article. Review.
-
A cell-based ribozyme reporter system employing a chromosomally-integrated 5' exonuclease gene.BMC Mol Cell Biol. 2021 Mar 16;22(1):20. doi: 10.1186/s12860-021-00357-7. BMC Mol Cell Biol. 2021. PMID: 33726662 Free PMC article.
-
Re-engineering electrochemical biosensors to narrow or extend their useful dynamic range.Angew Chem Int Ed Engl. 2012 Jul 2;51(27):6717-21. doi: 10.1002/anie.201202204. Epub 2012 Jun 5. Angew Chem Int Ed Engl. 2012. PMID: 22674785 Free PMC article.
-
Automated physics-based design of synthetic riboswitches from diverse RNA aptamers.Nucleic Acids Res. 2016 Jan 8;44(1):1-13. doi: 10.1093/nar/gkv1289. Epub 2015 Nov 30. Nucleic Acids Res. 2016. PMID: 26621913 Free PMC article.
References
-
- Bunka DH, Stockley PG. Aptamers come of age - at last. Nat Rev Microbiol. 2006;4:588–596. - PubMed
-
- Tombelli S, Minunni M, Mascini M. Analytical applications of aptamers. Biosens Bioelectron. 2005;20:2424–2434. - PubMed
-
- Chu T, Ebright J, Ellington AD. Using aptamers to identify and enter cells. Curr Opin Mol Ther. 2007;9:137–144. - PubMed
-
- Montange RK, Batey RT. Riboswitches: emerging themes in RNA structure and function. Annu Rev Biophys. 2008;37:117–133. - PubMed
Publication types
MeSH terms
Substances
Grants and funding
LinkOut - more resources
Full Text Sources
Other Literature Sources
