

An in-situ fluorescence-based optical extensometry system for imaging mechanically loaded bone
- PMID: 20041487
- PMCID: PMC2930264
- DOI: 10.1002/jor.21049
An in-situ fluorescence-based optical extensometry system for imaging mechanically loaded bone
Abstract
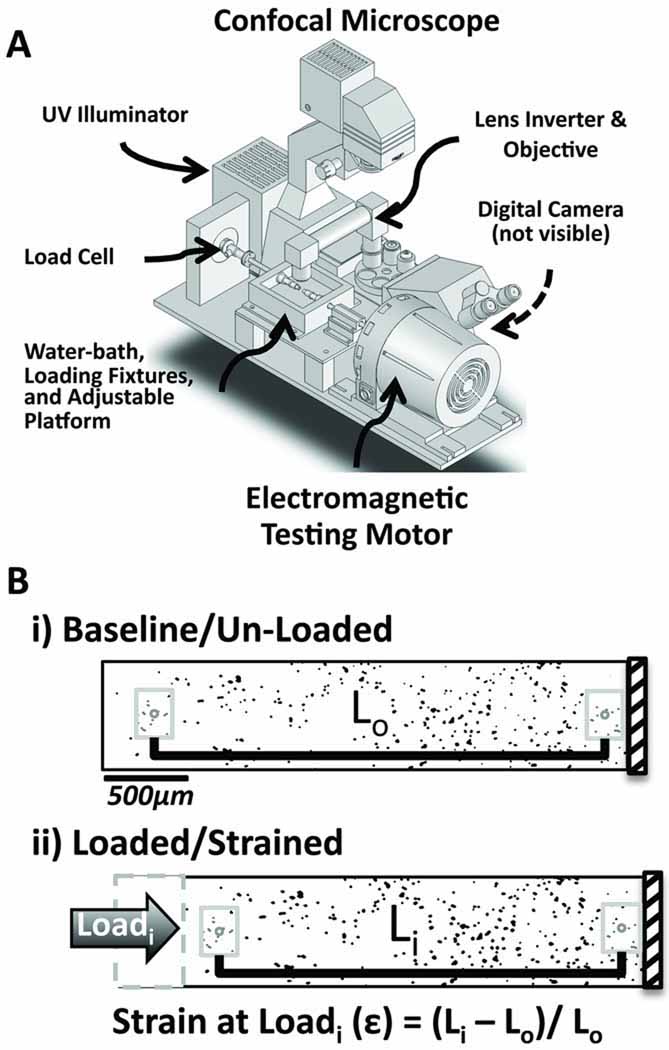
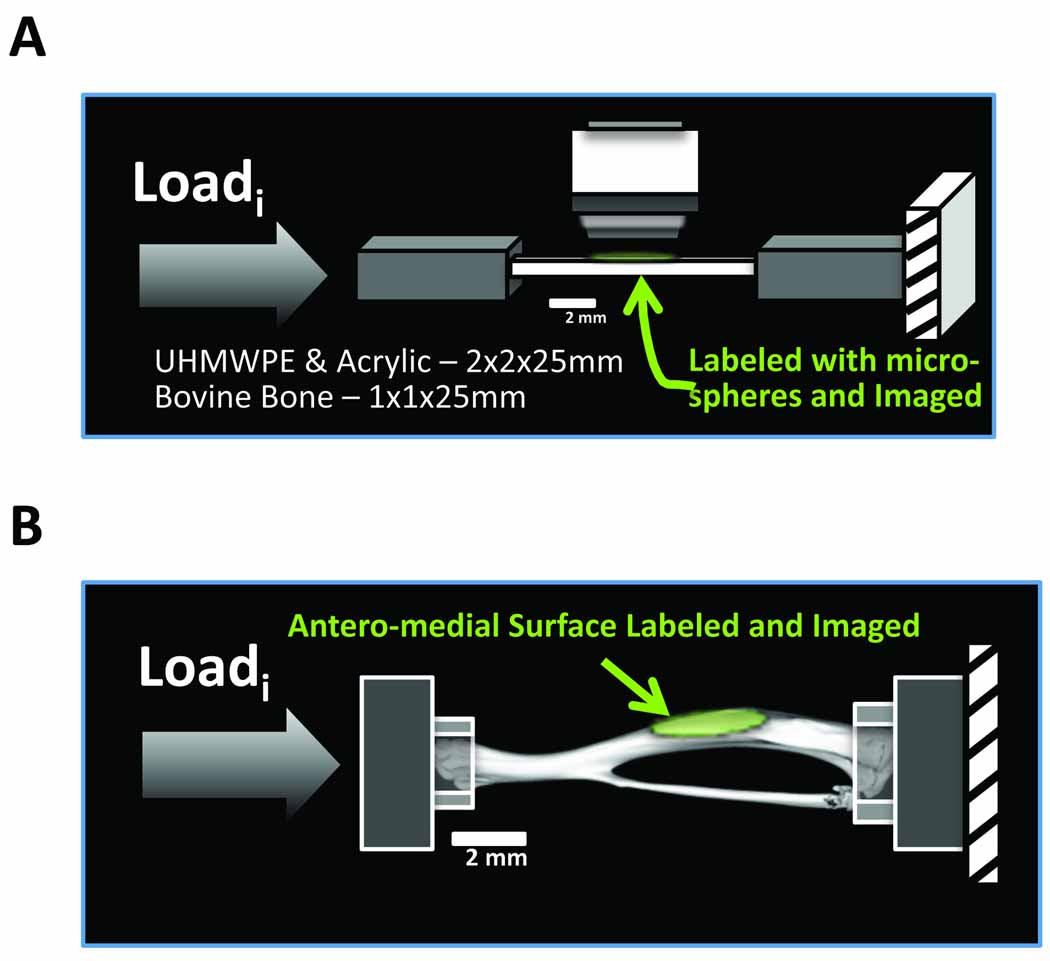
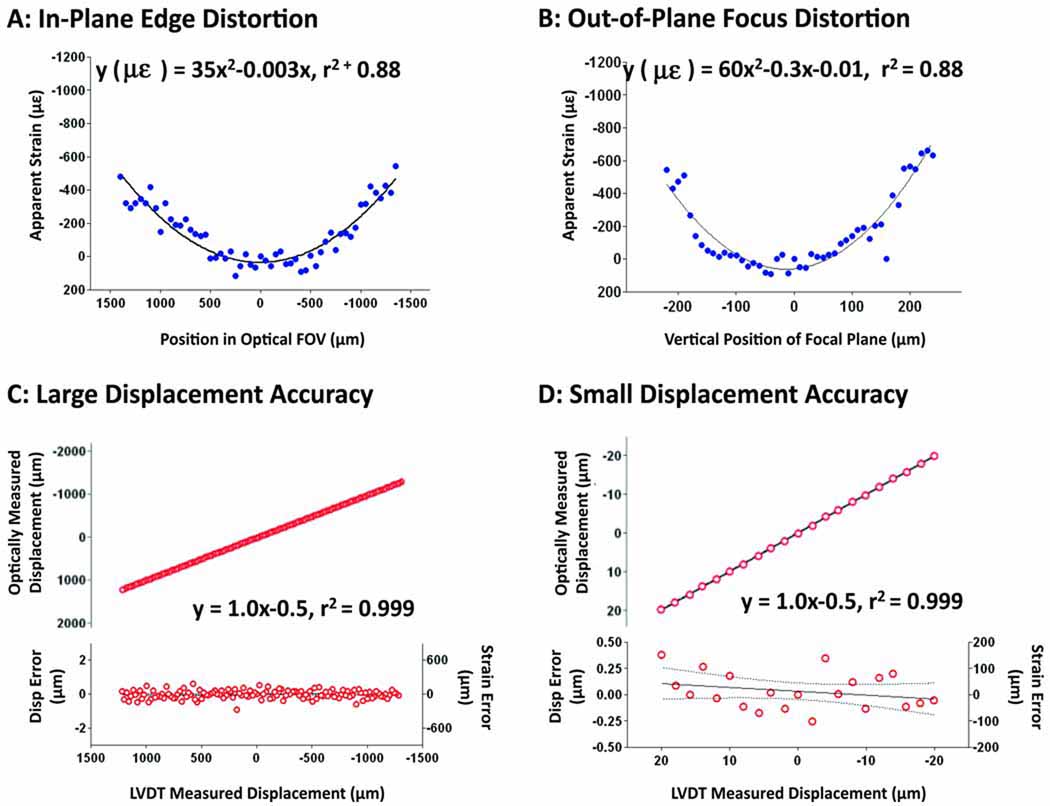
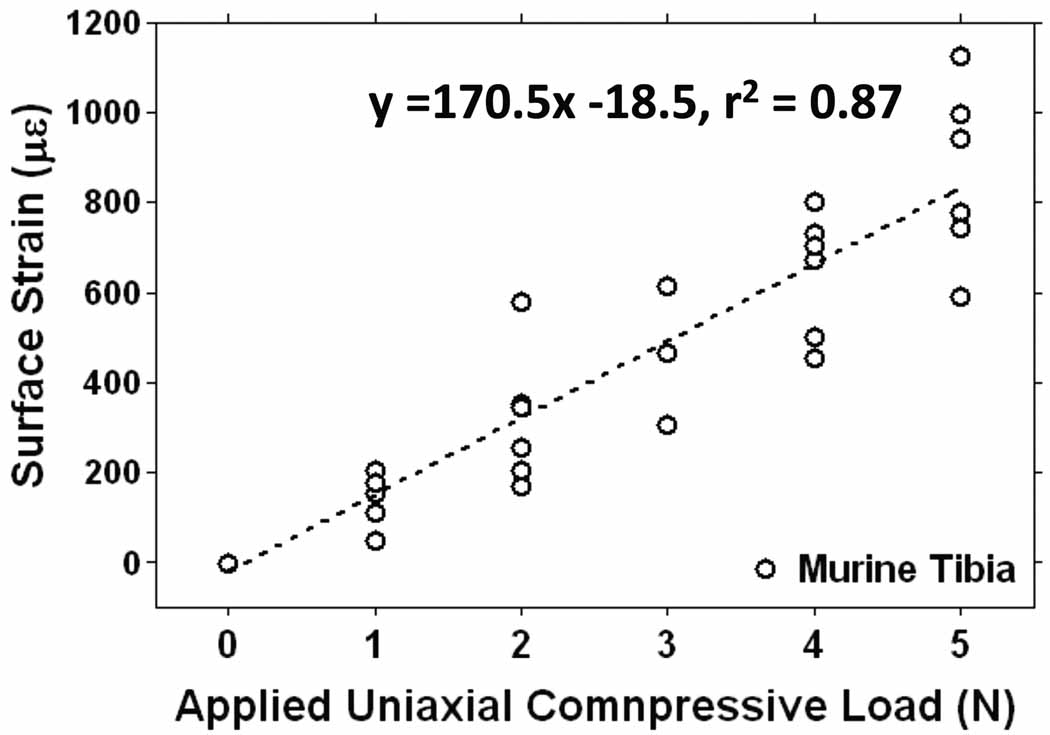
The application and quantification of well-controlled tissue strains is required for investigations into mechanisms of tissue adaptation within the musculoskeletal system. Although many commercial and custom extensometry systems exist for large biological samples, integrated loading/strain measurement for small samples is not as readily available. Advanced imaging modules such as laser scanning microscopy provide in situ, minimally invasive tools to probe cellular and molecular processes with high spatiotemporal resolution. Currently, a need exists to devise loading/strain measurement systems that can be integrated with such advanced imaging modules. We describe the development and validation of a fluorescence-based, optical extensometry system directly integrated within a confocal microscopy platform. This system allows in situ measurement of surface strain and is compatible with the direct imaging of cellular processes within small bone samples. This optical extensometry system can accurately and reproducibly measure physiologically relevant surface strains (200 to 3000 microstrain) in beams machined from various well-characterized materials, including bovine femoral cortex, and in intact murine tibia. This simple system provides a powerful tool to further our investigation of the relationships between mechanical loading, fluid and solute transport, and mechanosensation within the musculoskeletal system.
(c) 2009 Orthopaedic Research Society. Published by Wiley Periodicals, Inc.
Figures

References
-
- Cowin SC. Structural changes in living tissues. Meccanica. 1999;34(5):379–398. - PubMed
-
- Mackey AL, Heinemeier KM, et al. Dynamic adaptation of tendon and muscle connective tissue to mechanical loading. Connect Tissue Res. 2008;49(3):165–168. - PubMed
-
- Brommer H, Brama PA, et al. Functional adaptation of articular cartilage from birth to maturity under the influence of loading: a biomechanical analysis. Equine Vet J. 2005;37(2):148–154. - PubMed
-
- McCreadie BR, Hollister SJ. Strain Concentrations Surrounding an Ellipsoid Model of Lacunae and Osteocytes. Comput Methods Biomech Biomed Engin. 1997;1(1):61–68. - PubMed
Publication types
MeSH terms
Grants and funding
LinkOut - more resources
Full Text Sources
