. 2011 Jan;15(1):38-51.
doi: 10.1111/j.1582-4934.2009.00996.x.

Molecular characterization and functional properties of cardiomyocytes derived from human inducible pluripotent stem cells

Affiliations

Molecular characterization and functional properties of cardiomyocytes derived from human inducible pluripotent stem cells

Igal Germanguz et al. J Cell Mol Med. 2011 Jan.

Abstract

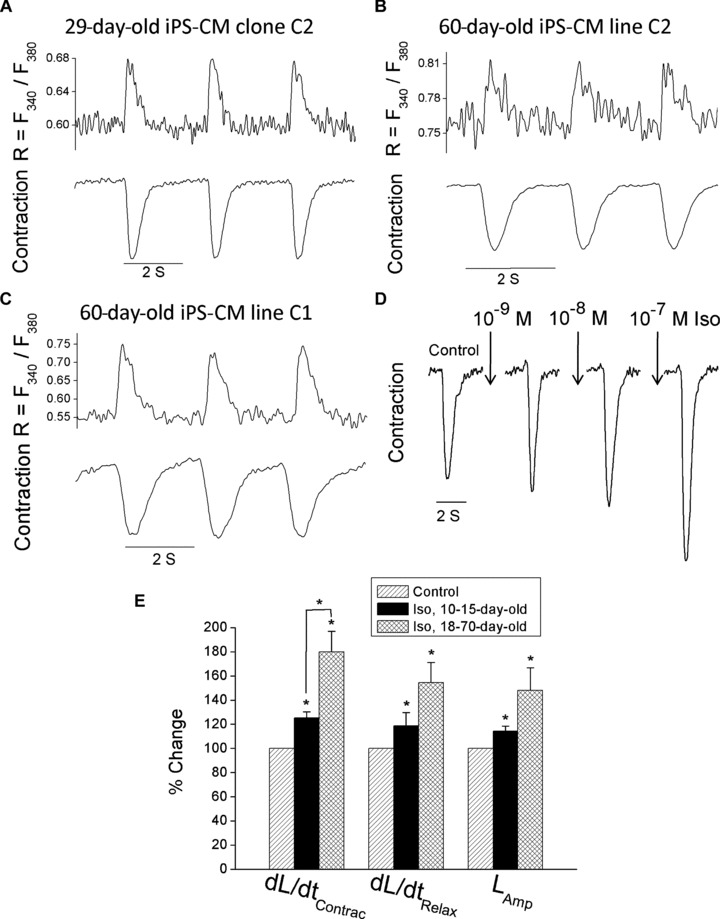
In view of the therapeutic potential of cardiomyocytes derived from induced pluripotent stem (iPS) cells (iPS-derived cardiomyocytes), in the present study we investigated in iPS-derived cardiomyocytes, the functional properties related to [Ca(2+) ](i) handling and contraction, the contribution of the sarcoplasmic reticulum (SR) Ca(2+) release to contraction and the b-adrenergic inotropic responsiveness. The two iPS clones investigated here were generated through infection of human foreskin fibroblasts (HFF) with retroviruses containing the four human genes: OCT4, Sox2, Klf4 and C-Myc. Our major findings showed that iPS-derived cardiomyocytes: (i) express cardiac specific RNA and proteins; (ii) exhibit negative force-frequency relations and mild (compared to adult) post-rest potentiation; (iii) respond to ryanodine and caffeine, albeit less than adult cardiomyocytes, and express the SR-Ca(2+) handling proteins ryanodine receptor and calsequestrin. Hence, this study demonstrates that in our cardiomyocytes clones differentiated from HFF-derived iPS, the functional properties related to excitation-contraction coupling, resemble in part those of adult cardiomyocytes.


Figures

Fig 1
Fig 1
iPS characterization as pluripotent ES-like cells: Human iPS were derived from HFF cells following retroviral infection with the four reprogramming factors and display morphology similar to that of hES cells: (A) iPS colony, hES (H9.2) colony and HFF morphology. (B) Immunofluorescence staining for pluripotent markers: Oct4, TRA-1–81, TRA-1–60 and SSEA4 for iPS clone 3. DAPI nuclear staining indicated on left panel. (C) Analysis of gene expression by PCR. The transcription of Oct4, Sox2, c-myc, Klf4, Nanog and Rex1 were analysed in three iPS clones C1, C2 and C3 as well in the hESC clone–H9.2 and parental HFF. GAPDH was used as amplification and loading control. (D, E) Spontaneous differentiation of human iPS into EBs and teratomas. Human iPS were induced to spontaneous differentiation in vitro and in vivo. (D) The upper left panel illustrates EBs derived from human iPS clone 3. Upper right and bottom left and right panels show immunofluorescence staining for markers of the three germ layers in human IPS derived EBs. Representative ectoderm marker β-tubulin-III, representative mesoderm marker SMA and representative endoderm marker α-Fetoprotein (E) Immunofluorescence staining for different markers (up) and haematoxylin and eosin staining demonstration of typical tissue morphology (bottom) were performed on teratomas to confirm derivatives of the three germ layers: ectoderm – representative marker Nestin staining and neural rosettes, mesoderm – SMA marker staining and cartilage endoderm – a-Fetoprotein marker staining and gut like epithelium.
Fig 2
Fig 2
Molecular characterization of iPS-derived cardiomyocytes. (A) RT-PCR analysis of cardiac markers in iPS-derived cardiomyocytes clone C2. Undifferentiated cells and micro-dissected contracting areas from EBs, from both iPS and ES cells were analysed for their expression of cardiac mesoderm (T-box 5 [Tbx5] and T-box 20 [Tbx20]) and cardiac markers (cardiac troponin T and α-cardiac actin). To exclude false-positive results due to contamination with genomic DNA, adequate controls without RT (–) were used. (B) Immunofluorescence staining of cardiac proteins in iPS-derived cardiomyocytes clone C2. Micro-dissected contracting areas from iPS-derived cardiomyocytes or cells clusters dissociated from these areas were stained for typical myofilament proteins. Cells were co-labelled with anti-cardiac troponin I (green) and either anti-sarcomeric α-actinin or myosin heavy chain (red). Nuclei were stained with DAPI (blue). Representative areas with apparent cross-striations are focused in the inserts. (C) Immunofluorescence staining of ryanodine receptor and calsequestrin in iPS-derived cardiomyocytes clone C2. Spontaneously contracting iPS-derived cardiomyocytes were fixed and stained as described in ‘Methods’ section. Red staining is for ryanodine receptor or calsequestrin; green staining is for the cardiac marker troponin I; blue staining is DAPI nuclei, and the last panel is a merge of all three layers. Magnification for ryanodine receptor staining is 2.7 × 63. Magnification for calsequestrin staining is 1 × 63.
Fig 3
Fig 3
Simultaneous recordings of [Ca2+]i transients and contractions of spontaneously contracting clones C1 and C2 iPS-derived cardiomyocytes and the effect of isoproterenol on iPS-derived cardiomyocytes clone C2. (A–C) Simultaneous recordings of [Ca2+]i transients and the contraction in 29- and 60-day-old clone C2 iPS-derived cardiomyocytes (A, B) and a 60-day-old clone C1 iPS-derived cardiomyocytes (C). (D) A representative experiment illustrating an increase in contraction amplitude in response to increasing concentrations of isoproterenol (the preparation was 18-day-old and stimulated at 0.5 Hz). (E) A summary of the effects of isoproterenol on the contraction parameters of 10–15- and 18–70-day-old iPS-derived cardiomyocytes clone C2 (n= 5 and n= 5–6, respectively). The effects of isoproterenol are presented as maximal responses (regardless of the drug concentration) and presented as percentage change of their respective controls. *P< 0.05. Abbreviations: iPS-CM, induced pluripotent stem cell-derived cardiomyocytes; Iso, isoproterenol; dL/dtContrac, maximal rate of contraction; dL/dtRelax, maximal rate of relaxation; LAmp, contraction amplitude.
Fig 4
Fig 4
Extracellular electrograms and an activation map in a network of iPS-derived cardiomyocytes recorded by means of the MEA data acquisition system. (A) A representative display of electrograms recorded from the entire MEA array. (B) A representative electrogram recorded at electrode # 66. (C) An activation map serving as a visual representation of the activation sequence. The map activation time (the time duration between first and last activations) is represented by the lower scale at the bottom of the map. The colour strip below the map represents the colour spectrum and its scaling according to time. Colour coding: red – early; blue – late.
Fig 5
Fig 5
FFRs in iPS-derived cardiomyocytes clones C1 and C2 and in hESC-derived cardiomyocytes clone H9.2. (A–D) Representative experiments illustrating a decrease in contraction amplitude in response to increase stimulation frequency in 14- (A) and 60-day-old (B) iPS-derived cardiomyocytes clone C2, in 70-day-old (C) iPS-derived cardiomyocytes clone C1 and in 30-day-old (D) hESC-derived cardiomyocytes clone H9.2. To generate the FFRs, contracting EBs were paced by means of electric field stimulation at 0.5, 0.7, 0.9, 1 and 1.2 Hz. (E) Average percentage change in contraction amplitude in response to increase in stimulation frequency in iPS-derived cardiomyocytes clone C2 (n= 7), clone C1 (n= 6) and in hESC-derived cardiomyocytes clone H9.2 (n= 3). The results are expressed as percentage change from the values at 0.5 Hz. *P, 0.05.
Fig 6
Fig 6
PRP in iPS-derived cardiomyocytes clones C1 and C2 and in hESC-derived cardiomyocytes clone H9.2. (A) Representative PRP contraction tracings from 35-day-old iPS-derived cardiomyocytes clone C2, depicting the control contraction recorded at 0.5 Hz, and the first post-rest contractions after rest periods of 10, 30 and 60 sec. (B) Representative PRP contraction tracings from 60-day-old iPS-derived cardiomyocytes clone C1, depicting the control contraction recorded at 0.5 Hz, and the first post-rest contractions after rest periods of 5, 30 and 60 sec. (C) Representative PRP contraction tracings from 30-day-old hESC-derived cardiomyocytes clone H9.2, depicting the control contraction recorded at 0.5 Hz, and the first post-rest contractions after rest periods of 5, 30 and 60 sec. (D) Average post-rest/pre-rest contraction amplitude ratios in 0.5 Hz paced iPS-derived cardiomyocytes clones C2 (n= 7) and clone C1 (n= 3) and in hESC-derived cardiomyocytes clone H9.2 (n= 3).
Fig 7
Fig 7
The effects of ryanodine on [Ca2+]i transients and contractions in iPS-derived cardiomyocytes and in hESC-derived cardiomyocytes clone H9.2 and the effects of caffeine on [Ca2+]i transients and contractions in iPS-derived cardiomyocytes. (A) Representative contraction tracings of 60-day-old iPS-derived cardiomyocytes clone C2 stimulated at 0.5 Hz, before and 8 min. after superfusion with ryanodine (10 μM) dissolved in Tyrode’s solution. Note the partial recovery of contraction amplitude after wash-out with Tyrode’s solution. (B) Representative contraction tracings of 30-day-old hESC-derived cardiomyocytes clone H9.2 stimulated at 0.5 Hz, before and 10 min. after superfusion with ryanodine (10 μM) dissolved in Tyrode’s solution. (C) The effects of ryanodine on contraction parameters of iPS-derived cardiomyocytes clones C1 (n= 3–4) and C2 (n= 5–6) and of hESC-derived cardiomyocytes clone H9.2 (n= 4). The results are expressed as percentage change from control. (D) Representative [Ca2+]i transients of a 10-day-old iPS-derived cardiomyocytes clone C2 stimulated at 0.5 Hz, before and after a brief puff (400 ml) of caffeine (10 μM). Note that a brief puff of Tyrode’s solution did not exert any effect on the [Ca2+]i transient. (E) Summary of the effect of caffeine on the diastolic [Ca2+]i ratio in iPS-derived cardiomyocytes clone C2 (n= 4). The results are expressed as percentage change from control. (A–E) *P, 0.05. Abbreviations as in Fig. 3.

References

    1. Wong BW, Rahmani M, Rezai N, et al. Progress in heart transplantation. Cardiovasc Pathol. 2005;14:176–80. - PubMed
    1. Hunt SA, Haddad F. The changing face of heart transplantation. J Am Coll Cardiol. 2008;52:587–98. - PubMed
    1. Habib M, Caspi O, Gepstein L. Human embryonic stem cells for cardiomyogenesis. J Mol Cell Cardiol. 2008;45:462–74. - PubMed
    1. Segers VF, Lee RT. Stem-cell therapy for cardiac disease. Nature. 2008;451:937–42. - PubMed
    1. Passier R, van Laake LW, Mummery CL. Stem-cell-based therapy and lessons from the heart. Nature. 2008;453:322–9. - PubMed

Publication types

MeSH terms