. 2009 Dec 30:10:641.
doi: 10.1186/1471-2164-10-641.

Deep RNA sequencing of L. monocytogenes reveals overlapping and extensive stationary phase and sigma B-dependent transcriptomes, including multiple highly transcribed noncoding RNAs

Affiliations

Deep RNA sequencing of L. monocytogenes reveals overlapping and extensive stationary phase and sigma B-dependent transcriptomes, including multiple highly transcribed noncoding RNAs

Haley F Oliver et al. BMC Genomics. .

Abstract

Background: Identification of specific genes and gene expression patterns important for bacterial survival, transmission and pathogenesis is critically needed to enable development of more effective pathogen control strategies. The stationary phase stress response transcriptome, including many sigmaB-dependent genes, was defined for the human bacterial pathogen Listeria monocytogenes using RNA sequencing (RNA-Seq) with the Illumina Genome Analyzer. Specifically, bacterial transcriptomes were compared between stationary phase cells of L. monocytogenes 10403S and an otherwise isogenic DeltasigB mutant, which does not express the alternative sigma factor sigmaB, a major regulator of genes contributing to stress response, including stresses encountered upon entry into stationary phase.

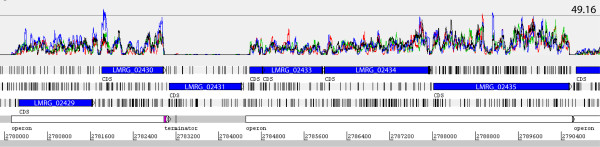
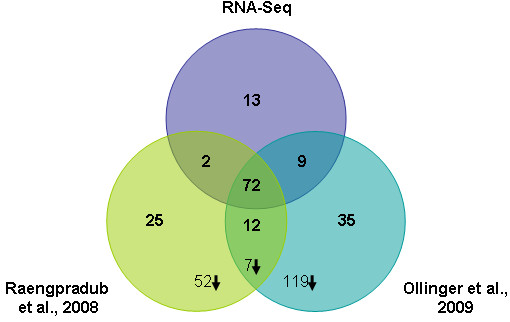
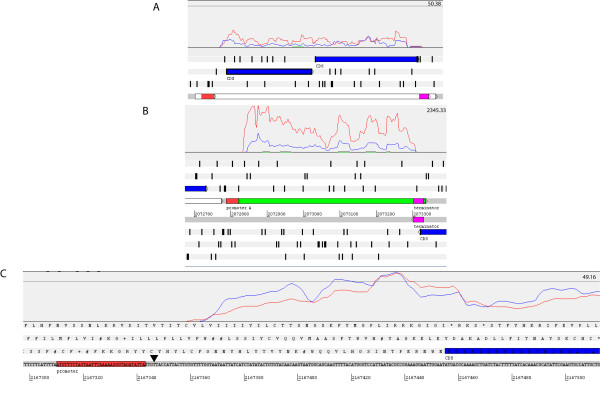
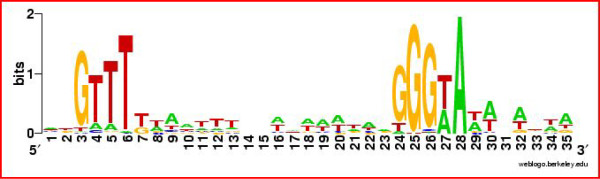
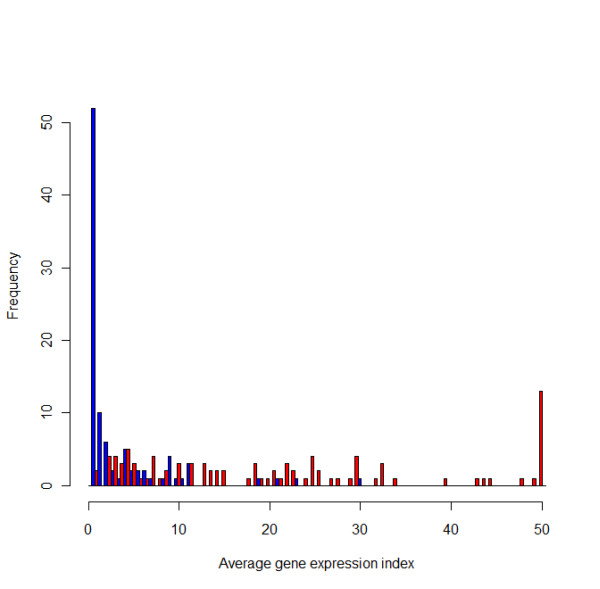
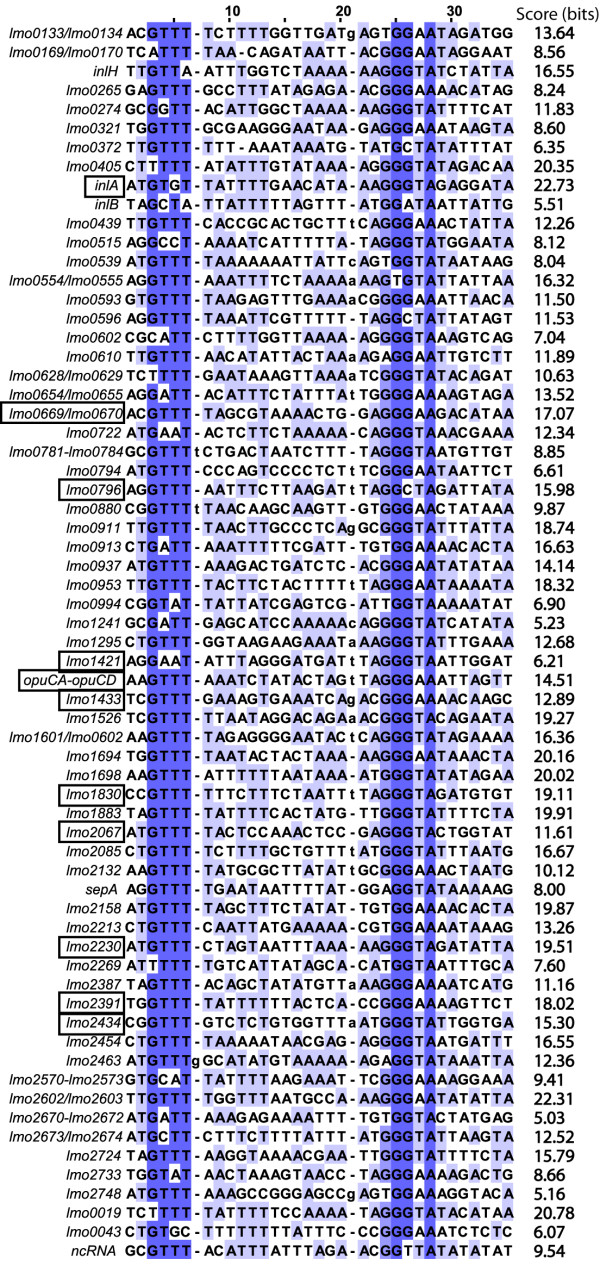
Results: Overall, 83% of all L. monocytogenes genes were transcribed in stationary phase cells; 42% of currently annotated L. monocytogenes genes showed medium to high transcript levels under these conditions. A total of 96 genes had significantly higher transcript levels in 10403S than in DeltasigB, indicating sigmaB-dependent transcription of these genes. RNA-Seq analyses indicate that a total of 67 noncoding RNA molecules (ncRNAs) are transcribed in stationary phase L. monocytogenes, including 7 previously unrecognized putative ncRNAs. Application of a dynamically trained Hidden Markov Model, in combination with RNA-Seq data, identified 65 putative sigmaB promoters upstream of 82 of the 96 sigmaB-dependent genes and upstream of the one sigmaB-dependent ncRNA. The RNA-Seq data also enabled annotation of putative operons as well as visualization of 5'- and 3'-UTR regions.

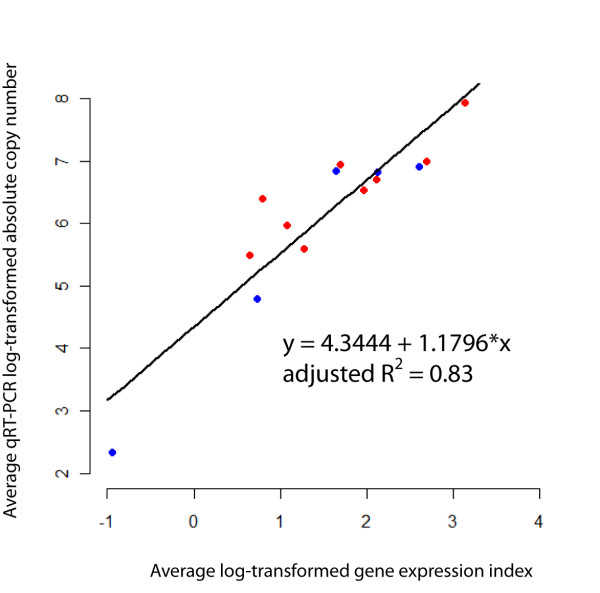
Conclusions: The results from these studies provide powerful evidence that RNA-Seq data combined with appropriate bioinformatics tools allow quantitative characterization of prokaryotic transcriptomes, thus providing exciting new strategies for exploring transcriptional regulatory networks in bacteria.


Figures

Figure 1
Figure 1
Correlation between qRT-PCR and RNA-Seq. Correlation between qRT-PCR and RNA-Seq data for selected genes in L. monocytogenes 10403S (red) and the ΔsigB strain (blue). The selected genes are: ctc, gadA, gap, opuCA, rpoB (qRT-PCR data from both strains were available for these 5 genes), flaA, inlA, plcA and sigB (only qRT-PCR data from 10403S were available for these 4 genes).
Figure 2
Figure 2
View of RNA-Seq data using the Artemis genome browser. This region of the 10403S chromosome includes six coding genes, i.e. LMRG_02429 to LMRG_02435, and the 5' end of LMRG_02436; genes are represented as blue arrows. The top part of the figure shows normalized RNA-Seq coverage (i.e. the number of reads that match an annotated gene after normalization across runs) with red and blue lines representing the two 10403S replicates and the green and black lines representing the ΔsigB strain. The horizontal line indicates a normalized RNA-Seq coverage of 49.16 reads. The middle part of the figure shows the three positive frames of translation with the coding regions and vertical black bars representing stop codons. The last line shows putative operons (white bars), a terminator (purple bar) downstream of LMRG_02430 and the chromosome coordinates. Notice the difference in coverage between LMRG_02431 (downstream of the terminator) and the other genes. All genes in the figure have sequencibility of 100% (See Additional file 1: Sequencibility text file for a complete sequencibility plot).
Figure 3
Figure 3
σB-dependent genes identified by RNA-Seq and microarray analyses. Venn diagram of σB-dependent genes identified in stationary phase cells in this study and in previous microarray studies of stationary phase L. monocytogenes [10,12]. Numbers in bold are the number of up-regulated annotated CDS identified as σB-dependent in each study; numbers followed by down arrows are down-regulated σB-dependent genes. No down-regulated σB-dependent genes were identified by RNA-Seq. The 13 genes identified as σB-dependent in stationary phase only by RNA-Seq, but not by previous microarray studies of L. monocytogenes 10403S, include 5 genes that had been found to be σB-dependent, by microarray studies [10] in salt stressed cells (see Table 5). In a number of instances, (e.g. opuCB, rsbX; See Additional file 8: Comparison of genes found to be σB-dependent by microarray analysis and not by RNA-Seq) genes with significantly different transcript levels in both microarrays [10,12] had significant binomial probabilities (q < 0.05) and a fold change ≥ 2.0 for most of the possible combinations (i.e. 10403S replicate 1 vs ΔsigB replicate 1; 10403S replicate 1 vs ΔsigB replicate 2; 10403S replicate 2 vs ΔsigB replicate 1; 10403S replicate 2 vs ΔsigB replicate 2), but not for all four comparisons and these genes were, therefore, not identified as showing significant differences in normalized RNA-Seq coverage (based on our conservative definition of genes with significant differences in normalized RNA-Seq coverage); see Additional file 8: Comparison of genes found to be σB-dependent by microarray analysis and not by RNA-Seq for detailed RNA-Seq data for genes identified as σB-dependent by microarrays, but not by RNA-Seq.
Figure 4
Figure 4
Examples of σB-dependent transcripts identified by RNA-Seq. In each panel (A, B, and C), red and blue lines representing normalized RNA-Seq coverage (i.e. the number of reads that match an annotated gene after normalization across runs) in the two 10403S replicates and green and black lines represent normalized RNA-Seq coverage in the ΔsigB strain replicates; the numbers at the top right in each panel indicates the normalized RNA-Seq coverage represented by the horizontal line shown. Panel (A) depicts LMRG_02382 and LMRG_02383 (shown as blue bars), which form an operon (indicated by a long white bar) with a defined Rho-independent terminator (purple bar) downstream of LMRG_02383; the three positive frames of translation with the coding regions in blue and stop codons shown as vertical black bars are also shown. A σB-dependent promoter (red bar) was identified upstream of the operon and the RNA-Seq coverage data clearly shows that the transcription of this operon is positively regulated by σB (i.e. almost no coverage was obtained from the ΔsigB strain). Panel (B) depicts SbrE (Rli47), a σB-dependent noncoding RNA (ncRNA) with Rho-independent terminator and a σB-dependent promoter identified; annotated features as well as positive and negative frames of translation are shown at the bottom with stop codons shown as vertical black bars. Panel (C) shows the 5' end of LMRG_01602 illustrating the position of a σB-dependent promoter in relation to the start codon of the gene and the transcriptional start site determined by RNA-Seq. The black triangle indicates the transcriptional start site determined by RACE-PCR as previously described by Kazmierczak et al. [23].
Figure 5
Figure 5
Logo of the σB promoter. This logo was created from the alignment of 65 σB promoters identified in this study.
Figure 6
Figure 6
Average gene expression indices for σB-dependent genes. The histogram shows the average GEI of σB-dependent genes in 10403S (red) and the ΔsigB (blue) strains. GEIs were grouped in intervals of 0.7, i.e., the first bar represents genes with GEIs between 0 and 0.7; the second bar represents GEIs between > 0.7 and ≤ 1.4, etc. Genes with average GEI ≥ 50 were grouped together.
Figure 7
Figure 7
Alignment of the 65 putative σB-dependent promoters identified in this study. EGD-e homologs of genes or operons downstream of a given promoters are indicated on the left. Positions 3 to 6 in the alignment represent the -35 region while positions 24 to 29 represent the -10 region. Darker nucleotides are more conserved than lighter nucleotides in the alignment. Gene names that are boxed indicated promoters that have been experimentally validated (e.g., by RACE-PCR).

References

    1. Wang Z, Gerstein M, Snyder M. RNA-Seq: a revolutionary tool for transcriptomics. Nat Rev Genet. 2009;10(1):57–63. doi: 10.1038/nrg2484. - DOI - PMC - PubMed
    1. Mead PS, Slutsker L, Dietz V, McCaig LF, Bresee JS, Shapiro C, Griffin PM, Tauxe RV. Food-related illness and death in the United States. Emerg Infect Dis. 1999;5(5):607–625. doi: 10.3201/eid0505.990502. - DOI - PMC - PubMed
    1. Begley M, Gahan CG, Hill C. Bile stress response in Listeria monocytogenes LO28: adaptation, cross-protection, and identification of genetic loci involved in bile resistance. Appl Environ Microbiol. 2002;68(12):6005–6012. doi: 10.1128/AEM.68.12.6005-6012.2002. - DOI - PMC - PubMed
    1. Phan-Thanh L, Gormon T. Analysis of heat and cold shock proteins in Listeria by two-dimensional electrophoresis. Electrophoresis. 1995;16(3):444–450. doi: 10.1002/elps.1150160172. - DOI - PubMed
    1. Watkins J, Sleath KP. Isolation and enumeration of Listeria monocytogenes from sewage, sewage sludge and river water. J Appl Bacteriol. 1981;50(1):1–9. - PubMed

Publication types

MeSH terms