. 2009 Dec 30:9:152.
doi: 10.1186/1471-2229-9-152.

Virus infection elevates transcriptional activity of miR164a promoter in plants

Affiliations

Virus infection elevates transcriptional activity of miR164a promoter in plants

Ariel A Bazzini et al. BMC Plant Biol. .

Abstract

Background: Micro RNAs (miRs) constitute a large group of endogenous small RNAs that have crucial roles in many important plant functions. Virus infection and transgenic expression of viral proteins alter accumulation and activity of miRs and so far, most of the published evidence involves post-transcriptional regulations.

Results: Using transgenic plants expressing a reporter gene under the promoter region of a characterized miR (P-miR164a), we monitored the reporter gene expression in different tissues and during Arabidopsis development. Strong expression was detected in both vascular tissues and hydathodes. P-miR164a activity was developmentally regulated in plants with a maximum expression at stages 1.12 to 5.1 (according to Boyes, 2001) along the transition from vegetative to reproductive growth. Upon quantification of P-miR164a-derived GUS activity after Tobacco mosaic virus Cg or Oilseed rape mosaic virus (ORMV) infection and after hormone treatments, we demonstrated that ORMV and gibberellic acid elevated P-miR164a activity. Accordingly, total mature miR164, precursor of miR164a and CUC1 mRNA (a miR164 target) levels increased after virus infection and interestingly the most severe virus (ORMV) produced the strongest promoter induction.

Conclusion: This work shows for the first time that the alteration of miR pathways produced by viral infections possesses a transcriptional component. In addition, the degree of miR alteration correlates with virus severity since a more severe virus produces a stronger P-miR164a induction.


Figures

Figure 1
Figure 1
Schematic representation of Arabidopsis miR164a locus and miR164a precursor. Size and position of the miR164a putative promoter (P-miR164a) are indicated and mature miR164a highlighted. The rectangular boxes show the two flanking ORFs and their chromosome position. +1 indicates the putative transcription start sites. Arrows indicate the direction of transcription.
Figure 2
Figure 2
Spatial and temporal expression patterns of GUS reporter gene driven by P-miR164a in transgenic Arabidopsis plants. (A) Leafs from 4 week old plants of the different lines used for this study. A1: Control 35S::GUS transgenic Arabidopsis line. A2, A3 and A4: three independent P-miR164a::GUS transgenic Arabidopsis lines with showing low, intermediate or strong GUS activity (lines L35, L50 and L56 respectively). A5: Control EV::GUS transgenic Arabidopsis line where no GUS staining was detected. (B) GUS staining of plants, organs or sections of the control 35S::GUS transgenic Arabidopsis line (B1, B3 and B5) and P-miR164a::GUS L56 transgenic plants (B2, B4, B6 to B9). (B2) Staining leafs of one week-old plants. (B4) Mature and immature flowers. (B6) Detail of dehiscence zone of the siliques. (B7) Flower transverse section showing the reporter gene activity in the septum that divides both locus from each theca. (B8 and B9) Stem transverse sections with GUS staining found in developing xylem vessels. (C) Time course of P-miR164a transcription activity during the development of P-miR164a::GUS L56 transgenic plants. The plants were stained from stages 1.04 to stage 8. The most intense GUS staining was observed in stages 1.13 to 5.1. Bar = 0.5 cm.
Figure 3
Figure 3
Effects of virus infections on P-miR164a activity. L56 and L35 P-miR164a::GUSArabidopsis transgenic lines and 35S::GUS control transgenic plants were virus-inoculated to quantify the effects in P-miR164a activity. (A) The bar chart shows the GUS activity mean value and standard error (SE) obtained in each group with n ≥ 10 from at least two biological replicates. Values were normalized to mock-inoculated controls of each line. Statistical comparisons were made by Kruskal-Wallis test with Dunn's post-test. Statistical differences between treated and mock-treated groups are shown. **p < 0.05, ***p < 0.01 compared to mock controls. (B) Representative RT-PCR of the pre-miR164a transcript in L56 transgenic plants. The housekeeping EF1α gene was amplified as an internal control. (C) Quantitative RT-PCR analysis to measure the level of the pre-miR164a in Arabidopsis thaliana Col 0 plants after ORMV infection. The chart shows the normalized CTs ± SE for each condition and the expression ratio between them calculated with REST algorithm.
Figure 4
Figure 4
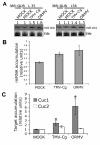
Effects of TMV-Cg and ORMV infections on the accumulation of miR164 and CUC1 and CUC2 mRNAs. (A) Northern blot analysis detecting the accumulation of miR164 in transgenic lines L35 and L56 after virus infection. Ethidium-bromide-stained rRNAs shown below each blot were used for data normalization. miR accumulation data were set relative according to the accumulation in mock-inoculated plants that was set at 1. (B) Average of two to four independent measurements of miR164 accumulation in L56 and L35 after virus infection. (C) CUC1 and CUC2 mRNAs transcript abundance determined by qRT-PCR and expressed in arbitrary units normalized to EF1α amount after virus infection. CUC1 and CUC2 transcript levels were computed relative to the levels in mock-inoculated plants that were set at 1. Each value represents the mean of four biological replicates. Bars indicate standard errors. (*) indicates a statistically significant difference (p < 0.008) for CUC1 relative expression in TMV-Cg and ORMV-infected plants compared to controls ones.
Figure 5
Figure 5
Effects of hormone treatments in P-miR164a activity in transgenic Arabidopsis plants. (A) L56, and L35 P-miR164a::GUS Arabidopsis transgenic lines and 35S::GUS control transgenic plants were hormone-treated as indicated in methods section. The bar chart shows the GUS activity mean value and the standard errors of results obtained in each group with n ≥ 10 from at least two biological replicates. Values were normalized to mock-treated controls of each line. Statistical comparisons were made by the Kruskal-Wallis test with Dunn's post-test. Statistical differences between treated and mock-treated groups are shown. **p < 0.05. (B) Effectiveness of hormone treatments by amplifying mRNAs that are known to be hormone inducible as ABA inducible RD22 (NM_122472); IAA inducible SAUR-AC1 (S70188) and GA3 inducible APT1 (NM_179383) genes. ACTIN2 gene was also amplified as internal control. M: 1 Kb DNA molecular marker; (-) Negative PCR control (without DNA).

References

    1. Bartel DP. MicroRNAs: genomics, biogenesis, mechanism, and function. Cell. 2004;116:281–297. doi: 10.1016/S0092-8674(04)00045-5. - DOI - PubMed
    1. Xie Z, Qi X. Diverse small RNA-directed silencing pathways in plants. Biochimica et biophysica acta. 2008;1779:720–724. - PubMed
    1. Ambros V. The functions of animal microRNAs. Nature. 2004;431:350–355. doi: 10.1038/nature02871. - DOI - PubMed
    1. Kurihara Y, Watanabe Y. Arabidopsis micro-RNA biogenesis through Dicer-like 1 protein functions. Proc Natl Acad Sci USA. 2004;101:12753–12758. doi: 10.1073/pnas.0403115101. - DOI - PMC - PubMed
    1. Schauer SE, Jacobsen SE, Meinke DW, Ray A. DICER-LIKE1: blind men and elephants in Arabidopsis development. Trends Plant Sci. 2002;7:487–491. doi: 10.1016/S1360-1385(02)02355-5. - DOI - PubMed

Publication types

MeSH terms

LinkOut - more resources