

Classification across gene expression microarray studies
- PMID: 20042109
- PMCID: PMC2811711
- DOI: 10.1186/1471-2105-10-453
Classification across gene expression microarray studies
Abstract
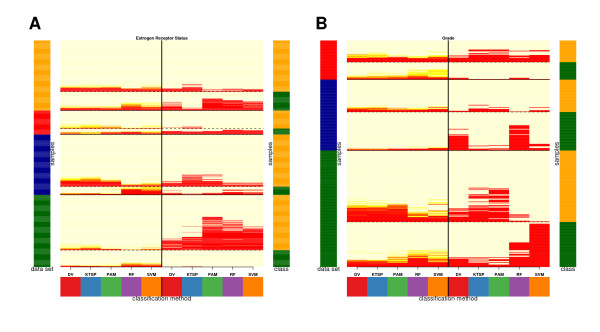
Background: The increasing number of gene expression microarray studies represents an important resource in biomedical research. As a result, gene expression based diagnosis has entered clinical practice for patient stratification in breast cancer. However, the integration and combined analysis of microarray studies remains still a challenge. We assessed the potential benefit of data integration on the classification accuracy and systematically evaluated the generalization performance of selected methods on four breast cancer studies comprising almost 1000 independent samples. To this end, we introduced an evaluation framework which aims to establish good statistical practice and a graphical way to monitor differences. The classification goal was to correctly predict estrogen receptor status (negative/positive) and histological grade (low/high) of each tumor sample in an independent study which was not used for the training. For the classification we chose support vector machines (SVM), predictive analysis of microarrays (PAM), random forest (RF) and k-top scoring pairs (kTSP). Guided by considerations relevant for classification across studies we developed a generalization of kTSP which we evaluated in addition. Our derived version (DV) aims to improve the robustness of the intrinsic invariance of kTSP with respect to technologies and preprocessing.
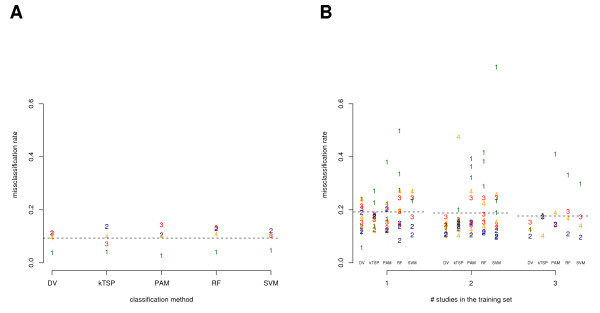
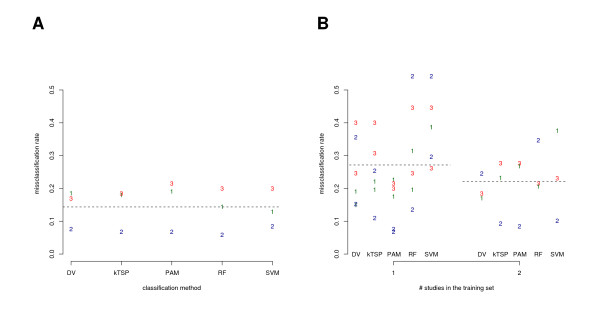
Results: For each individual study the generalization error was benchmarked via complete cross-validation and was found to be similar for all classification methods. The misclassification rates were substantially higher in classification across studies, when each single study was used as an independent test set while all remaining studies were combined for the training of the classifier. However, with increasing number of independent microarray studies used in the training, the overall classification performance improved. DV performed better than the average and showed slightly less variance. In particular, the better predictive results of DV in across platform classification indicate higher robustness of the classifier when trained on single channel data and applied to gene expression ratios.
Conclusions: We present a systematic evaluation of strategies for the integration of independent microarray studies in a classification task. Our findings in across studies classification may guide further research aiming on the construction of more robust and reliable methods for stratification and diagnosis in clinical practice.
Figures
Similar articles
-
Integration of RNA-Seq data with heterogeneous microarray data for breast cancer profiling.BMC Bioinformatics. 2017 Nov 21;18(1):506. doi: 10.1186/s12859-017-1925-0. BMC Bioinformatics. 2017. PMID: 29157215 Free PMC article.
-
Cross-platform analysis of cancer microarray data improves gene expression based classification of phenotypes.BMC Bioinformatics. 2005 Nov 4;6:265. doi: 10.1186/1471-2105-6-265. BMC Bioinformatics. 2005. PMID: 16271137 Free PMC article.
-
Mixture classification model based on clinical markers for breast cancer prognosis.Artif Intell Med. 2010 Feb-Mar;48(2-3):129-37. doi: 10.1016/j.artmed.2009.07.008. Epub 2009 Dec 14. Artif Intell Med. 2010. PMID: 20005686
-
A comprehensive sensitivity analysis of microarray breast cancer classification under feature variability.BMC Bioinformatics. 2009 Nov 26;10:389. doi: 10.1186/1471-2105-10-389. BMC Bioinformatics. 2009. PMID: 19941644 Free PMC article.
-
Microarrays in the 2010s: the contribution of microarray-based gene expression profiling to breast cancer classification, prognostication and prediction.Breast Cancer Res. 2011 Jun 27;13(3):212. doi: 10.1186/bcr2890. Breast Cancer Res. 2011. PMID: 21787441 Free PMC article. Review.
Cited by
-
Effect of size and heterogeneity of samples on biomarker discovery: synthetic and real data assessment.PLoS One. 2012;7(3):e32200. doi: 10.1371/journal.pone.0032200. Epub 2012 Mar 5. PLoS One. 2012. PMID: 22403633 Free PMC article.
-
Bayesian multi-source regression and monocyte-associated gene expression predict BCL-2 inhibitor resistance in acute myeloid leukemia.NPJ Precis Oncol. 2021 Jul 23;5(1):71. doi: 10.1038/s41698-021-00209-9. NPJ Precis Oncol. 2021. PMID: 34302041 Free PMC article.
-
Multiple-platform data integration method with application to combined analysis of microarray and proteomic data.BMC Bioinformatics. 2012 Dec 2;13:320. doi: 10.1186/1471-2105-13-320. BMC Bioinformatics. 2012. PMID: 23198695 Free PMC article.
-
Improving biomarker list stability by integration of biological knowledge in the learning process.BMC Bioinformatics. 2012 Mar 28;13 Suppl 4(Suppl 4):S22. doi: 10.1186/1471-2105-13-S4-S22. BMC Bioinformatics. 2012. PMID: 22536969 Free PMC article.
-
A Comparison of Logistic Regression, Logic Regression, Classification Tree, and Random Forests to Identify Effective Gene-Gene and Gene-Environmental Interactions.Int J Appl Sci Technol. 2012 Aug;2(7):268. Int J Appl Sci Technol. 2012. PMID: 23795347 Free PMC article.
References
-
- Chang HY, Nuyten DSA, Sneddon JB, Hastie T, Tibshirani R, Sorlie T, Dai H, He YD, van't Veer LJ, Bartelink H, Rijn M van de, Brown PO, Vijver MJ van de. Robustness, scalability, and integration of a wound-response gene expression signature in predicting breast cancer survival. Proc Natl Acad Sci USA. 2005;102(10):3738–43. doi: 10.1073/pnas.0409462102. - DOI - PMC - PubMed
-
- Miller LD, Smeds J, George J, Vega VB, Vergara L, Ploner A, Pawitan Y, Hall P, Klaar S, Liu ET, Bergh J. An expression signature for p53 status in human breast cancer predicts mutation status, transcriptional effects, and patient survival. Proc Natl Acad Sci USA. 2005;102(38):13550–5. doi: 10.1073/pnas.0506230102. - DOI - PMC - PubMed
-
- van't Veer LJ, Dai H, Vijver MJ van de, He YD, Hart AAM, Mao M, Peterse HL, Kooy K van der, Marton MJ, Witteveen AT, Schreiber GJ, Kerkhoven RM, Roberts C, Linsley PS, Bernards R, Friend SH. Gene expression profiling predicts clinical outcome of breast cancer. Nature. 2002;415(6871):530–536. doi: 10.1038/415530a. - DOI - PubMed
-
- Wang Y, Klijn JGM, Zhang Y, Sieuwerts AM, Look MP, Yang F, Talantov D, Timmermans M, van Gelder MEM, Yu J, Jatkoe T, Berns EMJJ, Atkins D, Foekens JA. Gene-expression profiles to predict distant metastasis of lymph-node-negative primary breast cancer. Lancet. 2005;365(9460):671–9. - PubMed
Publication types
MeSH terms
LinkOut - more resources
Full Text Sources
Research Materials
Miscellaneous
