Comparative Study
. 2010 Feb 1;184(3):1604-16.
doi: 10.4049/jimmunol.0903058. Epub 2009 Dec 30.

Peripheral blood CCR4+CCR6+ and CXCR3+CCR6+CD4+ T cells are highly permissive to HIV-1 infection

Affiliations
Comparative Study

Peripheral blood CCR4+CCR6+ and CXCR3+CCR6+CD4+ T cells are highly permissive to HIV-1 infection

Annie Gosselin et al. J Immunol. .

Abstract

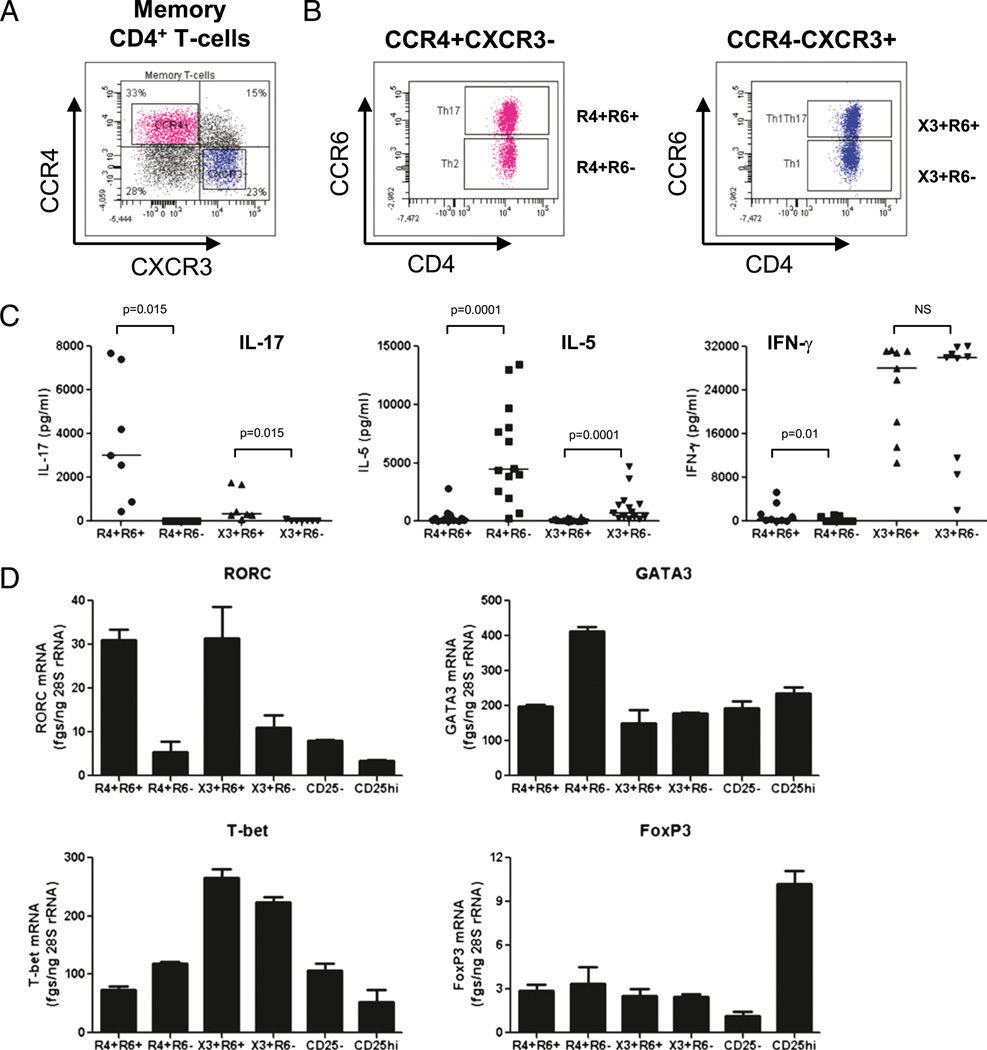
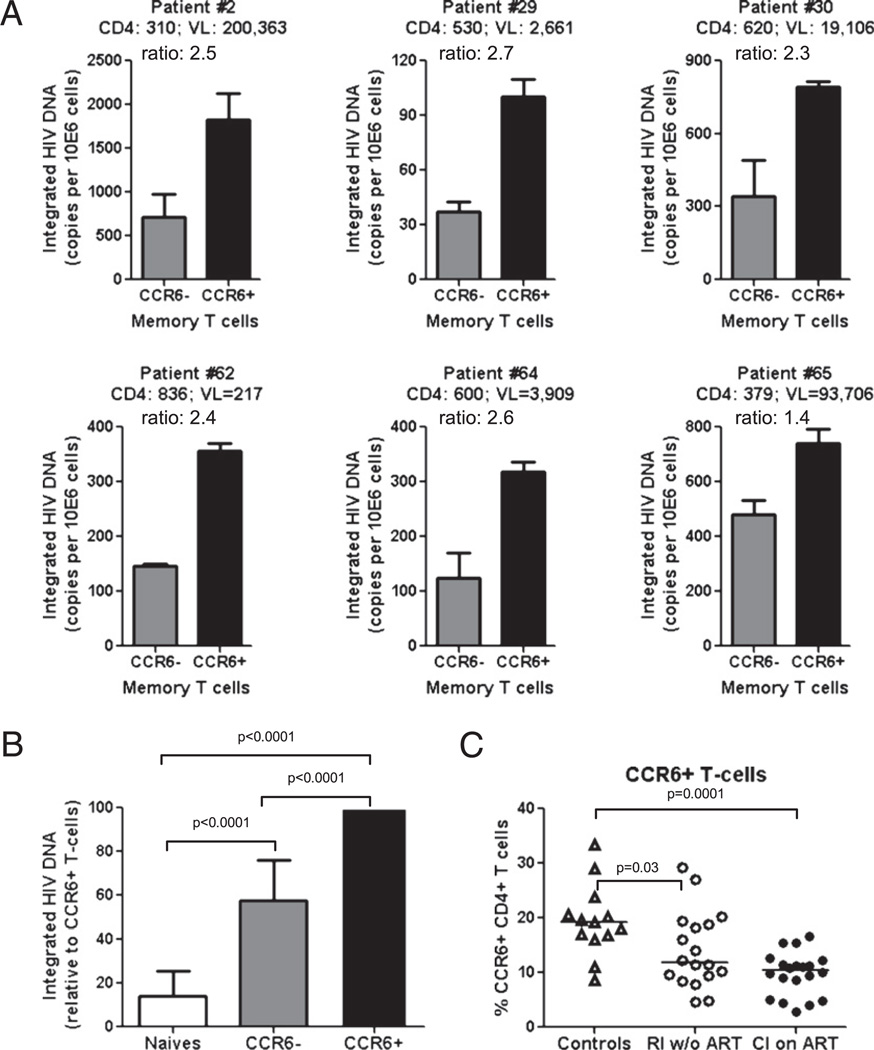
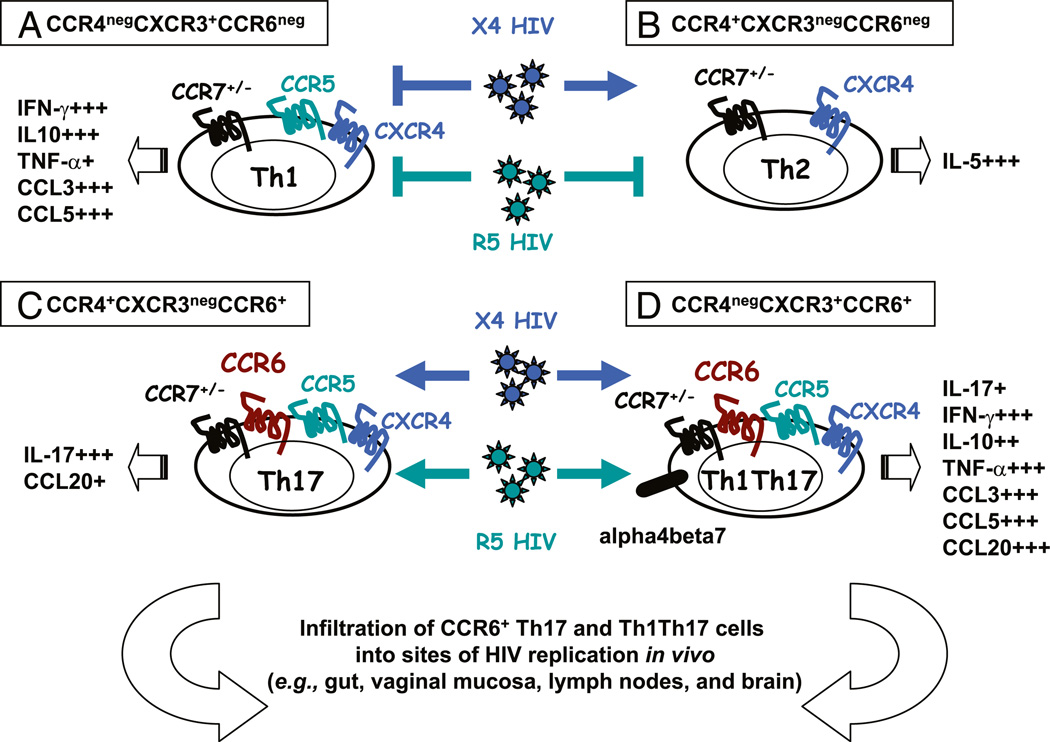
There is limited knowledge on the identity of primary CD4(+) T cell subsets selectively targeted by HIV-1 in vivo. In this study, we established a link between HIV permissiveness, phenotype/homing potential, and lineage commitment in primary CD4(+) T cells. CCR4(+)CCR6(+), CCR4(+)CCR6(-), CXCR3(+)CCR6(+), and CXCR3(+)CCR6(-) T cells expressed cytokines and transcription factors specific for Th17, Th2, Th1Th17, and Th1 lineages, respectively. CCR4(+)CCR6(+) and CXCR3(+)CCR6(+) T cells expressed the HIV coreceptors CCR5 and CXCR4 and were permissive to R5 and X4 HIV replication. CCR4(+)CCR6(-) T cells expressed CXCR4 but not CCR5 and were permissive to X4 HIV only. CXCR3(+)CCR6(-) T cells expressed CCR5 and CXCR4 but were relatively resistant to R5 and X4 HIV in vitro. Total CCR6(+) T cells compared with CCR6(-) T cells harbored higher levels of integrated HIV DNA in treatment-naive HIV-infected subjects. The frequency of total CCR6(+) T cells and those of CCR4(+)CCR6(+) and CXCR3(+)CCR6(+) T cells were diminished in chronically infected HIV-positive subjects, despite viral-suppressive therapy. A high-throughput analysis of cytokine profiles identified CXCR3(+)CCR6(+) T cells as a major source of TNF-alpha and CCL20 and demonstrated a decreased TNF-alpha/IL-10 ratio in CXCR3(+)CCR6(-) T cells. Finally, CCR4(+)CCR6(+) and CXCR3(+)CCR6(+) T cells exhibited gut- and lymph node-homing potential. Thus, we identified CCR4(+)CCR6(+) and CXCR3(+)CCR6(+) T cells as highly permissive to HIV replication, with potential to infiltrate and recruit more CCR6(+) T cells into anatomic sites of viral replication. It is necessary that new therapeutic strategies against HIV interfere with viral replication/persistence in discrete CCR6(+) T cell subsets.


Conflict of interest statement

Disclosures

The authors have no financial conflicts of interest.

Figures

FIGURE 1
FIGURE 1
The chemokine receptors CCR4, CXCR3, and CCR6 identify CD4+ T cells with distinct Th17, Th2, Th1Th17, and Th1 profiles. PBMCs from uninfected individuals were stained with CD3, CD4, CD45RA, CCR4, CXCR3, and CCR6 Abs and then analyzed by polychromatic flow cytometry. A, CCR4 and CXCR3 expression identified four subsets of memory (CD45RA) CD4+ T cells, including CCR4+CXCR3 and CCR4 CXCR3+ subsets. B, CCR6 expression distinguished four cell subsets within the CCR4+CXCR3 and CCR4CXCR3+ T cell subsets. Results in A and B are representative of experiments performed with cells from >10 different donors. C, D, T cells identified in B were sorted by flow cytometry and then stimulated via CD3/CD28 for 3 d. C, Cytokine production in culture supernatants was quantified by ELISA. D, Shown is real-time RT-PCR quantification of lineage-specific transcription factors. Results in C were obtained with cells from n = 7 (IL-17), n = 14 (IL-5), and n = 9 (IFN-γ) different donors. Wilcoxon signed-rank test p values are indicated in the figure. Horizontal lines indicate median values. Results in D are from one experiment representative of experiments performed with cells from n = 4 (for Th17, Th2, Th1Th17, and Th1) and n = 2 different donors (for CD25+ and CD25CD4+ T cells) (mean ± SD of duplicate wells).
FIGURE 2
FIGURE 2
The HIV coreceptor CCR5 is differentially expressed on CCR4+CCR6+, CCR4+CCR6, CXCR3+CCR6+, and CXCR3+CCR6 T cells. A– C, The expression of the HIV coreceptors CCR5 and CXCR4 was analyzed in CCR4+CCR6+, CCR4+CCR6, CXCR3+CCR6+, and CXCR3+CCR6 T cells gated as in Fig. 1A and 1B. A, Shown are histograms of CCR5 and CXCR4 expression in T cell subsets from one representative donor; B, statistical analysis of CCR5 expression (percentage and mean fluorescence intensity) in T cell subsets from n = 13 different donors; and C, statistical analysis of CXCR4 expression (percentage and mean fluorescence intensity) in T cells from n = 7 different donors. Wilcoxon signed-rank test p values are indicated in the figure. Horizontal lines indicate median values.
FIGURE 3
FIGURE 3
CCR4+CCR6+, CCR4+CCR6, CXCR3+CCR6+, and CXCR3+CCR6 T cells exhibit differential susceptibility to R5 and X4 HIV replication. FACS sorted T cell subsets were stimulated via CD3/CD28 for 3 d and exposedtoR5 (NL4.3BaL)orX4 (NL4.3) HIV strains for3 hat37°C. Unbound virus was removed by extensive washing, and cells were cultured at a concentration of 106 cells per milliliter in RPMI 1640 with 10% FBS and IL-2 (5 ng/ml). A, C, Supernatants were harvested every 3 d postinfection, and levels of HIV p24 were quantified by ELISA. B, D, E, F, Integrated and total HIV DNA levels were quantified by real-time PCR at days 3and12 postinfection. Shown are (A–D) HIV-p24 levels or HIV DNA copy numbers from one experiment representative of results obtained with cells from more than three different donors (mean ± SD of triplicate wells) and (E, F) relative integrated HIV DNA levels in CXCR3+ CCR6+ and CXCR3+CCR6 T cell subsets from three or four different donors. (E, F) Values above bars are integrated HIV DNA copy numbers per 106 cells in CXCR3+CCR6+ T cells.
FIGURE 4
FIGURE 4
CCR6+ T cells harbor relatively high levels of integrated HIV DNA, and their frequency is diminished in HIV-infected subjects. A, B, Matched naive (CD45RA+) and memory (CD45RA) CCR6+ and CCR6 T cell subsets were sorted by MACS and FACS from PBMCs of viremic treatment-naive HIV-infected subjects (Table I). Levels of integrated HIV DNA were quantified by real-time nested PCR. Shown are (A) integrated HIV DNA copy numbers per 106 CCR6+ and CCR6 T cells (mean ± SD of triplicate wells) and (B) relative integrated HIV DNA levels in naive and memory CCR6+ and CCR6 T cells (mean ± SD, n = 6). CD4 counts (cells per microliter), plasma viral loads (HIV RNA copies per milliliter), and paired t test p values are indicated in the figure. C, The frequency of memory CCR6+ T cells was analyzed in recently RI w/o ART (n = 18) and CI on ART (n = 20) individuals (Tables I and II) as compared with that in uninfected subjects (n = 13). Mann-Whitney U test p values are indicated in the figures. Horizontal lines indicate median values.
FIGURE 5
FIGURE 5
The frequency of CCR4+CCR6+ and CXCR3+CCR6+ T cell subsets but not CXCR3+CCR6 T cell subsets is diminished in HIV-infected subjects under ART. A, The frequency of CCR4+CCR6+, CCR4+CCR6, CXCR3+CCR6+, and CXCR3+CCR6 T cell subsets within the total memory fraction (CD45RA) was analyzed in RI w/o ART (n = 18) and CI on ART (n = 20) HIV-infected subjects (Tables I and II) as compared with that in uninfected subjects (n = 13). B, Shown are the correlations among the CCR4+CCR6+, CCR4+ CCR6, CXCR3+CCR6+, and CXCR3+CCR6 T cell counts and CD4 counts in CI on ART individuals (n = 20) (Table II). Spearman correlation p and r values and linear regression r2 values are indicated in the figure. C, The relative frequency of CCR4+CCR6+ (Th17 profile) and CXCR3+CCR6+ T cells (Th1Th17 profile) versus CXCR3+CCR6 T cells (Th1 profile) (percentage/percentage) was calculated in RI w/o ART and CI on ART HIV-infected subjects as compared with that in uninfected subjects. Mann-Whitney U test p values are indicated in the figure. Horizontal lines indicate median values.
FIGURE 6
FIGURE 6
CCR4+CCR6+, CCR4+ CCR6, CXCR3+CCR6+, and CXCR3+ CCR6 T cell subsets exhibit differential cytokine/chemokine profiles. Memory CCR4+CCR6+, CCR4+CCR6, CXCR3+ CCR6+, and CXCR3+CCR6 T cells were stimulated via CD3/CD28 for 3 d. A, Culture supernatants were screened for 60 soluble factors using the Cytokine Antibody Array VI (RayBiotec). Shown are results from one experiment representative of experiments performed with cells from two different donors. B, Levels of IL-10 (n = 11), TNF-α (n = 14), CCL20/MIP-3a (n = 14), CCL3/ MIP-1α (n = 6), and IL-2 (n = 12) were quantified by ELISA, whereas levels of CCL5/RANTES (n = 2) were quantified in cell supernatants by Cytometric Bead Array (mean ± SD). C, Shown are TNF-α/IL-10 ratios in CXCR3+CCR6+ and CXCR3+ CCR6 T cell subsets. Wilcoxon signed-rank test p values are indicated in the figure. Horizontal lines indicate median values.
FIGURE 7
FIGURE 7
CCR4+CCR6+ and CXCR3+CCR6+ T cell subsets exhibit gut- and lymph node-homing potential. Memory CCR4+CCR6+, CCR4+ CCR6, CXCR3+CCR6+, and CXCR3+CCR6 T cells from uninfected individuals were analyzed for the expression of (A) the integrin β7 and (B) CCR7. Shown are expression values in n = 13 HIV-uninfected subjects. Wilcoxon signed-rank test p values are indicated in the figure. Horizontal lines indicate median values.
FIGURE 8
FIGURE 8
Proposed model for the contribution of CCR4+CCR6+ and CXCR3+CCR6+ T cell subsets to HIV pathogenesis. A, CXCR3+CCR6 T cells (Th1 profile) are resistant to R5 and X4 HIV replication. B, CCR4+CCR6 T cells (Th2 profile) are permissive to X4 HIV only. C, CCR4+CCR6+ (Th17 profile) and (D) CXCR3+CCR6+ T cell subsets (Th1Th17 profile) are highly permissive to R5 and X4 HIV strains and have the potential to be recruited into the gut via the α4β7 integrin (49) and CCR6 (45), the lymph nodes via CCR7 (47), and the brain via CCR6 (71). They produce the CCR6 ligand CCL20, a chemokine critical for HIV dissemination from the site of portal entry (16). In addition, CXCR3+CCR6+ T cells are a major source of TNF-α, a proinflammatory cytokine previously linked to the positive regulation of HIV replication (38). We propose a model in which CCR4+CCR6+ Th17 and CXCR3+CCR6+ Th1Th17 T cells significantly contribute to HIV-1 pathogenesis by their ability to promote viral replication and attract more CCR6+ T cells at sites of HIV replication in vivo.

Similar articles

Cited by

References

    1. Douek DC, Picker LJ, Koup RA. T cell dynamics in HIV-1 infection. Annu. Rev. Immunol. 2003;21:265–304. - PubMed
    1. Blankson JN, Persaud D, Siliciano RF. The challenge of viral reservoirs in HIV-1 infection. Annu. Rev. Med. 2002;53:557–593. - PubMed
    1. Geeraert L, Kraus G, Pomerantz RJ. Hide-and-seek: the challenge of viral persistence in HIV-1 infection. Annu. Rev. Med. 2008;59:487–501. - PubMed
    1. Douek DC, Brenchley JM, Betts MR, Ambrozak DR, Hill BJ, Okamoto Y, Casazza JP, Kuruppu J, Kunstman K, Wolinsky S, et al. HIV preferentially infects HIV-specific CD4+ T cells. Nature. 2002;417:95–98. - PubMed
    1. Brenchley JM, Paiardini M, Knox KS, Asher AI, Cervasi B, Asher TE, Scheinberg P, Price DA, Hage CA, Kholi LM, et al. Differential Th17 CD4 T-cell depletion in pathogenic and nonpathogenic lentiviral infections. Blood. 2008;112:2826–2835. - PMC - PubMed

Publication types

MeSH terms