. 2010 Feb 26;285(9):6835-47.
doi: 10.1074/jbc.M109.068155. Epub 2009 Dec 30.

Toxoplasma gondii actin depolymerizing factor acts primarily to sequester G-actin

Affiliations

Toxoplasma gondii actin depolymerizing factor acts primarily to sequester G-actin

Simren Mehta et al. J Biol Chem. .

Abstract

Toxoplasma gondii is a protozoan parasite belonging to the phylum Apicomplexa. Parasites in this phylum utilize a unique process of motility termed gliding, which is dependent on parasite actin filaments. Surprisingly, 98% of parasite actin is maintained as G-actin, suggesting that filaments are rapidly assembled and turned over. Little is known about the regulated disassembly of filaments in the Apicomplexa. In higher eukaryotes, the related actin depolymerizing factor (ADF) and cofilin proteins are essential regulators of actin filament turnover. ADF is one of the few actin-binding proteins conserved in apicomplexan parasites. In this study we examined the mechanism by which T. gondii ADF (TgADF) regulates actin filament turnover. Unlike other members of the ADF/cofilin (AC) family, apicomplexan ADFs lack key F-actin binding sites. Surprisingly, this promotes their enhanced disassembly of actin filaments. Restoration of the C-terminal F-actin binding site to TgADF stabilized its interaction with filaments but reduced its net filament disassembly activity. Analysis of severing activity revealed that TgADF is a weak severing protein, requiring much higher concentrations than typical AC proteins. Investigation of TgADF interaction with T. gondii actin (TgACT) revealed that TgADF disassembled short TgACT oligomers. Kinetic and steady-state polymerization assays demonstrated that TgADF has strong monomer-sequestering activity, inhibiting TgACT polymerization at very low concentrations. Collectively these data indicate that TgADF promoted the efficient turnover of actin filaments via weak severing of filaments and strong sequestering of monomers. This suggests a dual role for TgADF in maintaining high G-actin concentrations and effecting rapid filament turnover.


Figures

FIGURE 1.
FIGURE 1.
Comparison of apicomplexan ADFs with representative ADF/Cofilin proteins. A, ClustalX alignment of ADF/Cofilin family members highlighting key features. Actin binding sites previously identified in S. cerevisiae cofilin by mutagenesis (29) or synchrotron protein footprinting (34) are indicated by asterisk or circle, respectively. Residues required exclusively for F-actin binding are boxed in black. Serine 3, glycine 66, and C-terminal residues that were mutated or added back in TgADF to analyze the actin binding sites in Fig. 3, are boxed in purple. Sequences shown are: AtADF1, A. thaliana ADF1; AcActophorin, A. castellani actophorin; ScCOF, S. cerevisiae cofilin; SpCOF, S. pombe cofilin; CeUnc60A, C. elegans Unc60A; PfADF2, P. falciparum ADF2; HsADF, H. sapiens ADF; PfADF1, P. falciparum ADF1; and TgADF, T. gondii ADF. B, homology model of T. gondii ADF (TgADF, shown in yellow) based on A. castellani actophorin (Actophorin, Protein Data Bank entry 1ahq, shown in blue). Arrow points to the short F-loop in TgADF compared with actophorin.
FIGURE 2.
FIGURE 2.
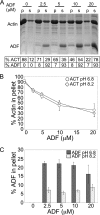
Characterization of T. gondii ADF activity. A, dose-dependent disassembly of rabbit actin filaments by TgADF. A representative Sypro-Ruby-stained gel showing the effect of increasing concentrations of TgADF on the amount of F-actin pelletting at 100,000 × g. Quantitation of the proportion of actin and TgADF in the pellet and supernatant fractions is given below. Rabbit actin (10 μm) was polymerized into filaments by the addition of F buffer, before incubation with TgADF (0–20 μm). Samples were centrifuged (100,000 × g) to sediment actin filaments, and the pellet (p) and supernatant (s) fractions were analyzed by SDS-PAGE. Bands were quantified by phosphorimaging analysis of Sypro-Ruby-stained gels. B, effect of pH on the disassembly of filaments by TgADF. Quantitation of the proportion of actin in the pellet fraction after interaction with TgADF at pH 6.8 or 8.2 is shown. Rabbit actin was polymerized under normal conditions (pH 8) and interacted with TgADF at either pH 6.8 or 8.2 (n = 3 experiments, mean ± S.E.). C, effect of pH on TgADF co-sedimentation with actin filaments. Quantitation of the proportion of TgADF in the pellet fraction after interaction with rabbit actin at pH 6.8 or 8.2 is shown (n = 3 experiments, mean ± S.E.).
FIGURE 3.
FIGURE 3.
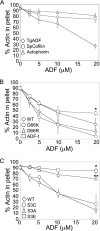
Comparison of TgADF activity with other ADF/Cofilin proteins, and mutational analysis of actin binding sites. A, comparison of TgADF activity with ADF/Cofilin proteins S. pombe cofilin and A. castellani actophorin. Quantitation of the proportion of actin sedimenting at 100,000 × g after polymerization by the addition of F buffer and incubation with TgADF, S. pombe cofilin (SpCofilin) or A. castellani actophorin (Actophorin). Experiments were done as described in Fig. 2. (n = 3 experiments, mean ± S.E.). B, effect of putative F-actin binding sites on TgADF activity. The filament disassembly activity of TgADF expressing the conserved basic F-loop residue (G66K or G66R) or the C-terminal residues of S. pombe cofilin (ADF-t) was compared with wild-type (WT) TgADF. The graph shows the relative proportion of actin sedimenting at 100,000 × g (n = 3 experiments, mean ± S.E.; *, p < 0.005 Student's t test, ADF-t versus WT). C, activity of TgADF serine 3 mutants. Actin filament disassembly activity of TgADF with mutations at the serine 3 residue to cysteine (S3C), alanine (S3A), or glutamic acid (S3E), were compared with WT TgADF (WT). The graph shows the relative proportion of actin sedimenting at 100,000 × g (n = 3 experiments, mean ± S.E.; *, p < 0.001 Student's t test, S3E versus WT; **, p < 0.05 Student's t test, S3A versus S3E).
FIGURE 4.
FIGURE 4.
Severing activity of TgADF as observed by TIRF microscopy. A, severing of actin filaments by TgADF and S. pombe cofilin. Fluorescence time-lapse micrographs of actin filaments were taken over a period of 0–12 min after the addition of 0.3 μm S. pombe cofilin (SpCOF, top), 0.3 μm TgADF (middle), or 1.5 μm TgADF (bottom) at time zero. Rabbit actin co-polymerized with Alexa Fluor 488-labeled actin was tethered to flow chambers with N-ethylmaleimide-treated myosin. Time-lapse TIRF microscopy was used to visualize filament severing by TgADF and S. pombe cofilin over time. Scale bar, 10 μm. B, quantitation of the rate of filament disassembly by TgADF and S. pombe cofilin. The average length (mean ± S.E.) of the 15 longest filaments in the field of view was calculated at the indicated time points after TgADF or SpCOF addition and plotted for each condition (n = 3 experiments). C, detailed montage of actin filaments being severed by 1.5 μm TgADF over time. Scale bar, 10 μm.
FIGURE 5.
FIGURE 5.
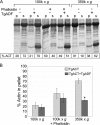
Interaction of TgADF with T. gondii actin filaments during sedimentation. A, effect of TgADF on the sedimentation activity of T. gondii actin filaments polymerized by the addition of F buffer. A representative Sypro-Ruby-stained SDS-PAGE gel shows the proportion of T. gondii actin sedimenting at 100,000 × g or 350,000 × g in the absence and presence of phalloidin or TgADF. Quantitation of the actin bands is indicated in the table below. p = pellet, s = supernatant. B, quantitation of the percentage of actin in the pellet fraction under the conditions in (A) based on three independent experiments, mean ± S.E.; *, p < 0.005 Student's t test, TgACT alone versus TgACT plus TgADF.
FIGURE 6.
FIGURE 6.
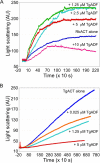
Effects of TgADF on actin polymerization kinetics. A, effect of TgADF on rabbit actin polymerization. Polymerization of rabbit actin (RbACT, 5 μm) was measured by light scattering in the presence of 0–10 μm TgADF. Rabbit actin was incubated with TgADF for 10 min prior to initiation of polymerization with the addition of 1/10th the volume of 10× KMEI. A representative experiment is shown (n = 3). B, effect of TgADF on T. gondii actin polymerization. Polymerization of T. gondii actin (TgACT, 5 μm) in the presence of 0–5 μm TgADF was measured over time by light scattering. Experiments were done as in A, with 5 μm phalloidin added at the time of polymerization, to stabilize T. gondii actin filaments. A representative experiment is shown (n = 2).
FIGURE 7.
FIGURE 7.
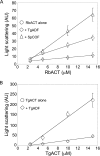
Effect of TgADF on steady-state actin polymerization. A, effect of TgADF on the steady-state polymerization of rabbit actin as measured by light scattering. Varying concentrations of rabbit actin (RbACT, 2–15 μm) were polymerized in KMEI buffer, in the presence of 2.5 molar excess TgADF or S. pombe cofilin (SpCOF) at 25 °C until steady state was achieved. The data represents the average (mean ± S.E.) of three independent experiments. B, effect of TgADF on T. gondii actin steady-state polymerization as measured by light scattering. Varying concentrations of T. gondii actin (TgACT, 2–15 μm) were polymerized in KMEI buffer, in the presence of equimolar phalloidin and 2.5 molar excess TgADF at 25 °C until steady state was achieved. The data represent the average (mean ± S.E.) of three independent experiments.
FIGURE 8.
FIGURE 8.
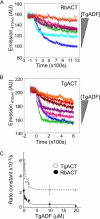
Effect of TgADF on nucleotide exchange of G-actin. A, effect of TgADF on the nucleotide exchange rate of monomeric rabbit actin (RbACT). The nucleotide exchange rate of ϵ-ATP-labeled Mg-actin monomers (1 μm), in the presence of varying concentrations of TgADF (0–20 μm), was monitored by measuring the loss in fluorescence over time (emission = 410 nm), upon the addition of 1.25 mm unlabeled ATP at time = 0. A representative experiment is shown (n = 3). The concentrations of TgADF used, given in order of appearance, were 0, 0.1, 0.25, 1, 2, 0.5, 10, and 20 μm (represented by a shaded triangle to the right of the graph). AU = arbitrary units. B, effect of TgADF on the nucleotide exchange rate of T. gondii actin (TgACT) monomers. The rate of nucleotide exchange on TgACT monomers was measured in the presence of varying concentrations of TgADF (0–20 μm). Experiments were done as in A. A representative experiment is shown (n = 3). The concentrations of TgADF used, given in order of appearance, were 0.25, 0, 0.5, 1, 2, 10, and 20 μm (represented by a shaded triangle to the right of the graph). C, plot of the observed rate constants for nucleotide exchange on TgACT and RbACT monomers in the presence of varying concentrations of TgADF. Rate constants were derived from the initial reaction rates calculated from curves similar to those shown in A and B and plotted against TgADF concentration. The data were fit using first-order exponential decay kinetics and represent the averages of two (RbACT), or three (TgACT), independent experiments (mean ± S.E.).

Similar articles

Cited by

References

    1. Joynson D. H., Wreghitt T. J. (2001) Toxoplasmosis: A Comprehensive Clinical Guide, Cambridge University Press, New York
    1. Mead P. S., Slutsker L., Dietz V., McCaig L. F., Bresee J. S., Shapiro C., Griffin P. M., Tauxe R. V. (1999) Emerg. Infect. Dis. 5, 607–625 - PMC - PubMed
    1. Barragan A., Sibley L. D. (2003) Trends Microbiol. 11, 426–430 - PubMed
    1. Sibley L. D. (2004) Science 304, 248–253 - PubMed
    1. Dobrowolski J. M., Sibley L. D. (1996) Cell 84, 933–939 - PubMed

Publication types