. 2010 Mar 5;285(10):7097-110.
doi: 10.1074/jbc.M109.038604. Epub 2009 Dec 30.

SIRT1 suppresses activator protein-1 transcriptional activity and cyclooxygenase-2 expression in macrophages

Affiliations

SIRT1 suppresses activator protein-1 transcriptional activity and cyclooxygenase-2 expression in macrophages

Ran Zhang et al. J Biol Chem. .

Abstract

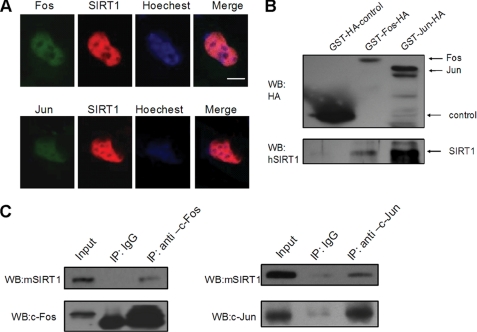
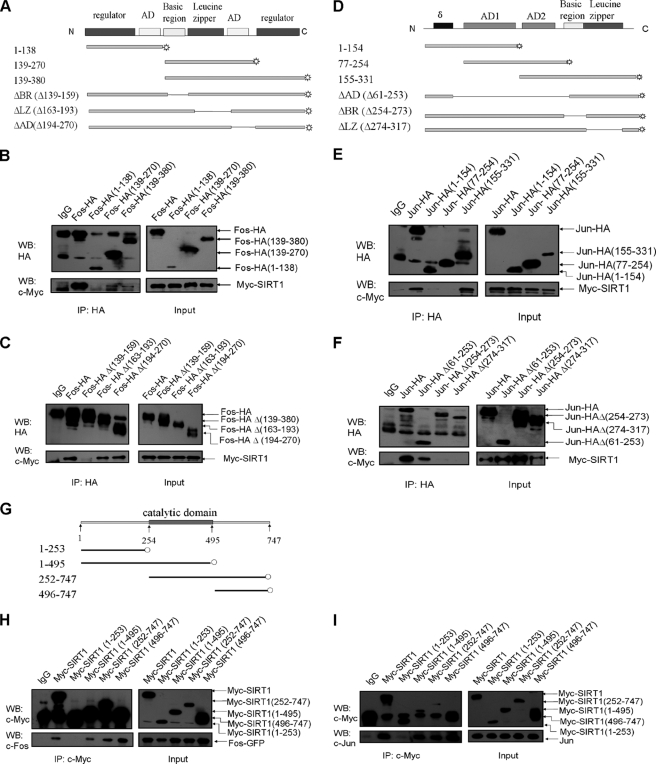
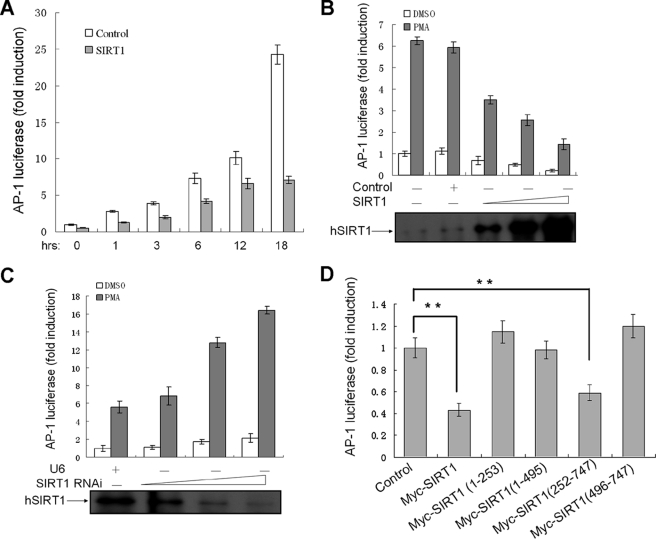
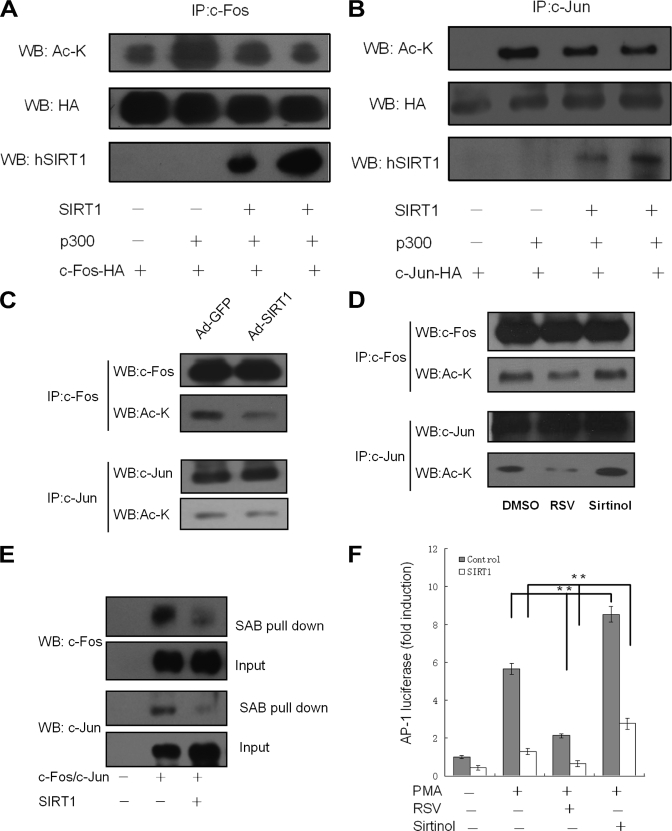
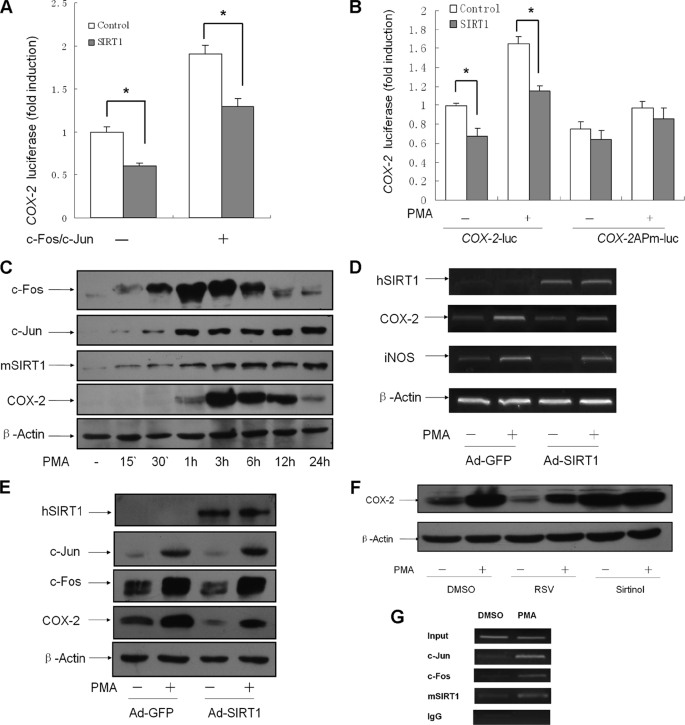
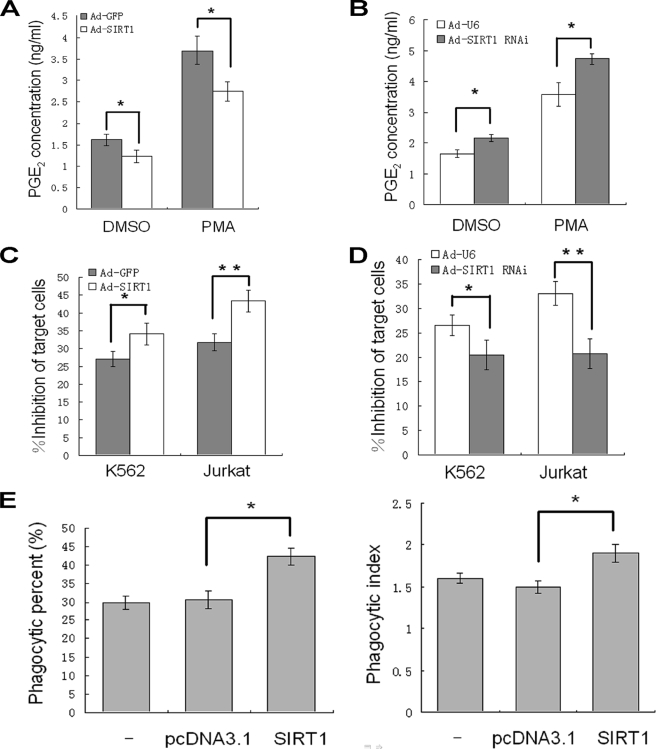
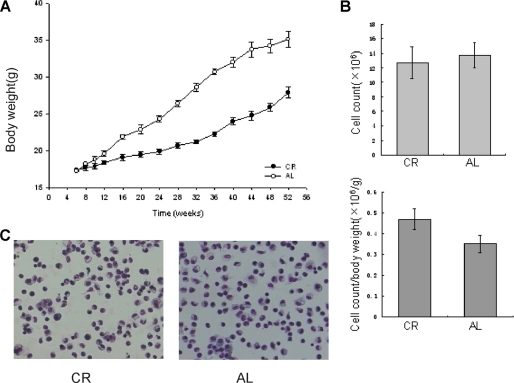
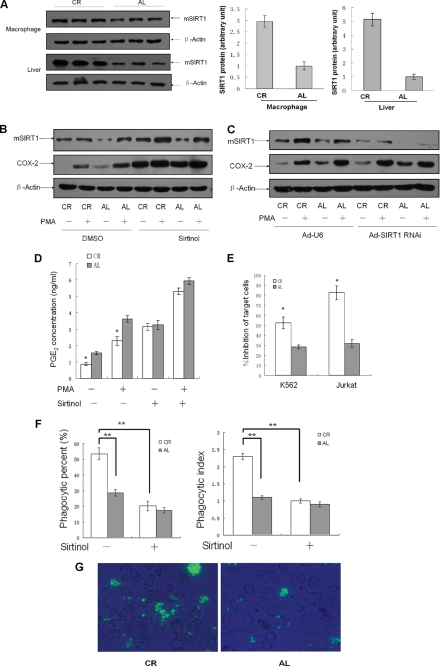
SIRT1 (Sirtuin type 1), a mammalian orthologue of yeast SIR2 (silent information regulator 2), has been shown to mediate a variety of calorie restriction (CR)-induced physiological events, such as cell fate regulation via deacetylation of the substrate proteins. However, whether SIRT1 deacetylates activator protein-1 (AP-1) to influence its transcriptional activity and target gene expression is still unknown. Here we demonstrate that SIRT1 directly interacts with the basic leucine zipper domains of c-Fos and c-Jun, the major components of AP-1, by which SIRT1 suppressed the transcriptional activity of AP-1. This process requires the deacetylase activity of SIRT1. Notably, SIRT1 reduced the expression of COX-2, a typical AP-1 target gene, and decreased prostaglandin E(2) (PGE(2)) production of peritoneal macrophages (pMPhis). pMPhis with SIRT1 overexpression displayed improved phagocytosis and tumoricidal functions, which are associated with depressed PGE(2). Furthermore, SIRT1 protein level was up-regulated in CR mouse pMPhis, whereas elevated SIRT1 decreased COX-2 expression and improved PGE(2)-related macrophage functions that were reversed following inhibition of SIRT1 deacetylase activity. Thus, our results indicate that SIRT1 may be a mediator of CR-induced macrophage regulation, and its deacetylase activity contributes to the inhibition of AP-1 transcriptional activity and COX-2 expression leading to amelioration of macrophage function.


Figures

FIGURE 1.
FIGURE 1.
SIRT1 interacts with c-Fos and c-Jun. A, HEK293 cells were transfected with plasmids coding for SIRT1 fused to Cherry and c-Fos or c-Jun fused to GFP. The nuclei were stained with Hoechst 33342 (blue). The cells were analyzed by fluorescent microscopy. The scale bar represents 10 μm. B, GST pulldown assay examines the direct interaction between SIRT1 and AP-1 in vitro. C, pMΦs were treated with PMA (50 ng/ml) for 3 h and were lysed for IP and Western blotting (WB) as indicated. The images are representative of three independent experiments.
FIGURE 2.
FIGURE 2.
Identification of the binding domain on AP-1 and SIRT1. A, D, and G, schematic diagram of human c-Fos (A), c-Jun (D), and SIRT1 (G) is shown. AD, activation domain; BR, basic region; LZ, leucine zipper. B, C, E, F, H, and I, HEK293 cells were transfected with the indicated expression vectors for 36 h and were lysed for IP and Western blotting (WB). Plasmids encoding HA-tagged full-length or deletion mutants of c-Fos were co-transfected with plasmids encoding Myc-tagged SIRT1 into cells (B and C). Similar studies were performed in cells transfected with plasmids encoding HA-tagged c-Jun and Myc-tagged SIRT1 (E and F). The cells expressing Myc-tagged deletion mutants of SIRT1 and GFP-fused c-Fos or HA-tagged c-Jun were analyzed using IP and Western blotting (H and I). The images are representative of two independent experiments.
FIGURE 3.
FIGURE 3.
SIRT1 suppresses AP-1 transcriptional activity. A, HEK293 cells were transiently transfected with 0.1 μg of AP-1 luciferase reporter (AP-1-luc), 30 ng of pRL-TK, and SIRT1 expression vectors or control (pcDNA3.1) for 24 h and were co-cultured with PMA (50 ng/ml) or vehicle DMSO. The relative luciferase activities were measured at the different time points. The relative luciferase activities are presented as the means ± standard deviation (S.D.) of triplicate samples and are representative of three independent experiments. B and C, AP-1-luc and pRL-TK were co-transfected into HEK293 cells with increasing amounts of the SIRT1 expression (0.1, 0.3, and 0.9 μg) or SIRT1 RNAi plasmid (0.3, 1.5, and 3 μg) for 24 h. The cells were stimulated with PMA (50 ng/ml) for 3 h, and the relative luciferase activities were measured. Proteins from the DMSO-treated samples were separated by SDS-PAGE and probed to detect hSIRT1. D, HEK293 cells transfected with 0.1 μg of AP-1-luc, 30 ng of pRL-TK, and 1 μg of SIRT1 expression vectors or control (pcDNA4-Myc) were stimulated with PMA (50 ng/ml) for 3 h, and the luciferase activities were examined. **, p < 0.01 versus control.
FIGURE 4.
FIGURE 4.
SIRT1 deacetylase activity is important for suppression of AP-1. A and B, HEK293 cells were co-transfected with p300, SIRT1 expression vector and HA tagged c-Fos (A) or HA tagged c-Jun (B) as indicated. The cell extracts were immunoprecipitated with anti-HA antibody and probed with the different antibodies. C, pMΦs were infected with Ad-GFP or Ad-SIRT1 for 36 h and treated with PMA (50 ng/ml) for 3 h. D, pMΦs were treated with RSV (50 μm) and Sirtinol, respectively, (25 μm) for 1 h followed by PMA (50 ng/ml) for 3 h. The cell extracts were immunoprecipitated and probed with indicated antibodies. The figures are representative of three independent experiments. E, nuclear extracts were incubated with biotinylated oligonucleotides containing the AP-1 binding sequence of COX-2 promoter and streptavidin-agarose beads (SAB), and the precipitated complex was analyzed by Western blotting (WB). Input was used as a control. The images are representative of two independent experiments. F, HEK293 cells were co-transfected with 0.1 μg of AP-1-luc and 0.3 μg of indicated expression vectors. The cells were further treated with RSV (50 μm) and Sirtinol (25 μm), respectively, for 1 h followed by PMA (50 ng/ml) for 3 h. The luciferase activities are presented as the means ± S.D. of triplicate samples and are representative of three independent experiments. **, p < 0.01.
FIGURE 5.
FIGURE 5.
SIRT1 inhibits COX-2 expression in macrophages. A, c-Fos/c-Jun expression plasmids (0.1 μg of each) and 0.3 μg of COX-2-luc were co-transfected with 0.3 μg of SIRT1 expression vector or control (pcDNA3.1) into HEK293 cells. Luciferase activities are presented as the means ± S.D. of triplicate samples and are representative of three independent experiments. *, p < 0.05 versus control. B, HEK293 cells transfected with 0.3 μg of COX-2-luc or COX-2APm-luc (AP-1 site mutant) and 0.3 μg of SIRT1 or control vector were treated with PMA (50 ng/ml) or vehicle for 3 h. The data present the means ± S.D. of triplicate samples and are representative of three independent experiments. *, p < 0.05 versus control. C, pMΦs were treated with PMA (50 ng/ml) for the indicated time. The protein expression of c-Fos, c-Jun, mSIRT1, and COX-2 was analyzed by Western blotting (WB). D and E, pMΦs infected with Ad-SIRT1 or control Ad-GFP were treated with PMA (50 ng/ml) for 3 h. COX-2 expression levels at RNA and protein were analyzed by reverse transcription-PCR (D) and WB (E). The images are representative of three experiments with similar results. F, pMΦs were pretreated with RSV (50 μm), Sirtinol (25 μm), and vehicle DMSO, respectively, for 1 h and then incubated with PMA (50 ng/ml) for another 3 h. Western blotting was performed using extracted protein. The images are representative of three experiments with similar results. G, chromatin was prepared from pMΦs treated with PMA (50 ng/ml) or DMSO for 3 h. Chromatin IP analysis was carried out with primers for mouse COX-2 promoter. The images are representative of three independent experiments with similar results.
FIGURE 6.
FIGURE 6.
SIRT1 improves macrophage functions. A and B, pMΦs were infected with Ad-GFP or Ad-SIRT1 (A) or Ad-U6 or Ad-SIRT1 RNAi (B), respectively, for 36 h and treated with PMA (50 ng/ml) or DMSO as control for 3 h. The PGE2 production are presented as the means ± S.D. of three independent experiments. *, p < 0.05. C and D, adenovirus-infected pMΦs were co-cultured with K562 or Jurkat cells for 24 h. Leukemia growth inhibition by macrophages is presented as the means ± S.D. of three independent experiments. *, p < 0.05; **, p < 0.01. E, RAW264.7 cells transfected with SIRT1 expression plasmid or vector control (pcDNA3.1) or not transfected were co-cultured with FITC-labeled yeast. The phagocytic percentage and phagocytic index were calculated, and the data are presented as the means ± S.D. of three independent experiments. *, p < 0.05.
FIGURE 7.
FIGURE 7.
CR does not influence macrophage formation. A and B, mean weekly body weights (A) and the number of pMΦs (B) for mice of AL and CR group were examined. The data are the means ± S.D. derived from 10 mice of each group. C, pMΦs were stained with May-Grünwald Giemsa.
FIGURE 8.
FIGURE 8.
Elevated SIRT1 in macrophages of CR mouse decreases COX-2 expression and improves PGE2-related macrophage functions. A, SIRT1 expression in pMΦs and liver from mice of each group was analyzed by Western blotting. Each lane represents an individual mouse. The data are presented as the means ± S.D. of three samples. B and C, Western blotting analysis of COX-2 expression in pMΦs from AL and CR mice. pMΦs were treated with Sirtinol (25 μm) for 3 h (B) or were infected with SIRT1 RNAi adenovirus for 36 h (C) followed by treatment with PMA (50 ng/ml) or vehicle for another 3 h. The images are representative of six experiments with similar results. D, pMΦs were treated with Sirtinol (25 μm) or vehicle DMSO for 3 h and PMA (50 ng/ml) for another 3 h, and PGE2 production is presented as the means ± S.D. of three independent experiments. **, p < 0.01 versus the AL group. E–G, the tumoricidal activity (E) and phagocytosis of pMΦs (F and G) from each group were analyzed. The data are presented as the means ± S.D. of six independent experiments. **, p < 0.01.

Similar articles

Cited by

References

    1. Eferl R., Wagner E. F. (2003) Nat. Rev. Cancer 3, 859–868 - PubMed
    1. Angel P., Imagawa M., Chiu R., Stein B., Imbra R. J., Rahmsdorf H. J., Jonat C., Herrlich P., Karin M. (1987) Cell 49, 729–739 - PubMed
    1. Miotto B., Struhl K. (2006) Mol. Cell Biol. 26, 5969–5982 - PMC - PubMed
    1. Lee S. K., Kim J. H., Lee Y. C., Cheong J., Lee J. W. (2000) J. Biol. Chem. 275, 12470–12474 - PubMed
    1. Vries R. G., Prudenziati M., Zwartjes C., Verlaan M., Kalkhoven E., Zantema A. (2001) EMBO J. 20, 6095–6103 - PMC - PubMed

Publication types

MeSH terms