. 2010 Mar 5;285(10):7056-66.
doi: 10.1074/jbc.M109.084038. Epub 2009 Dec 30.

TbPIF1, a Trypanosoma brucei mitochondrial DNA helicase, is essential for kinetoplast minicircle replication

Affiliations

TbPIF1, a Trypanosoma brucei mitochondrial DNA helicase, is essential for kinetoplast minicircle replication

Beiyu Liu et al. J Biol Chem. .

Abstract

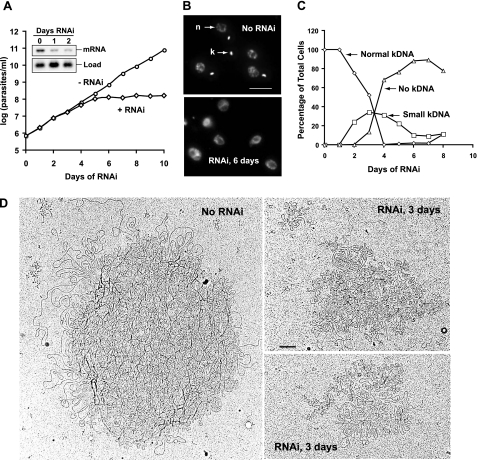
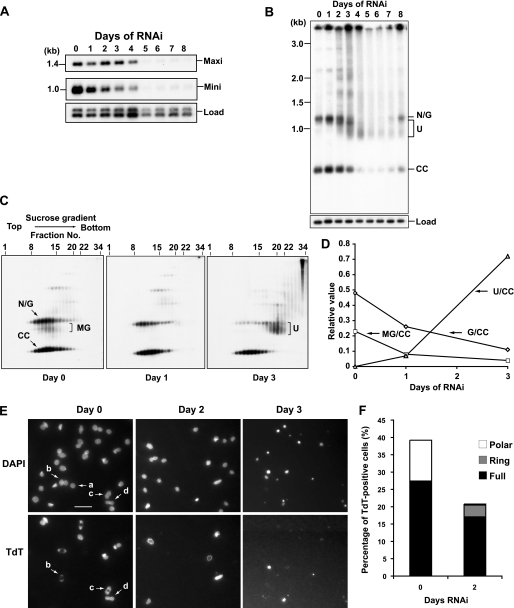
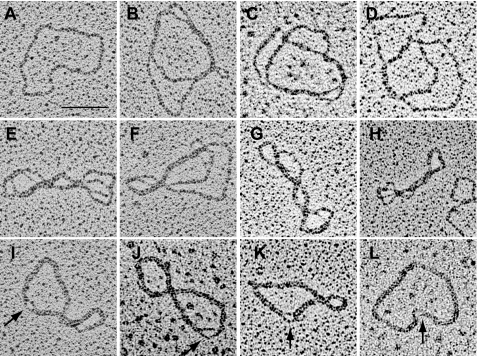
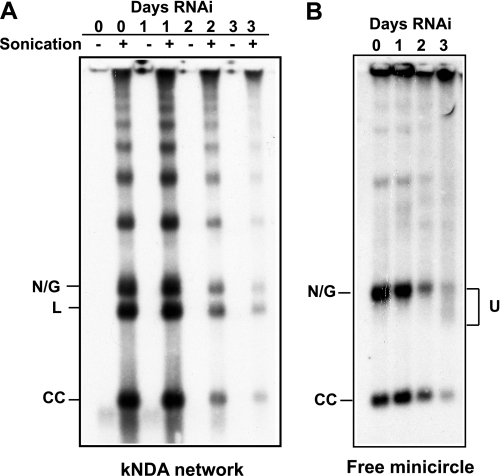
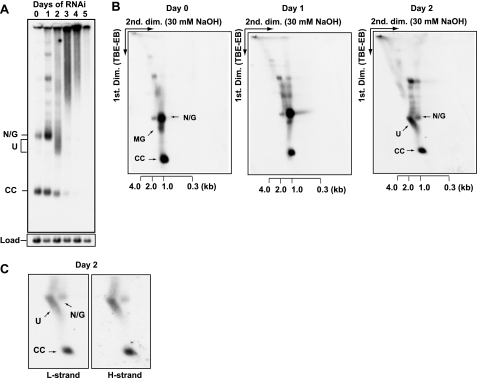
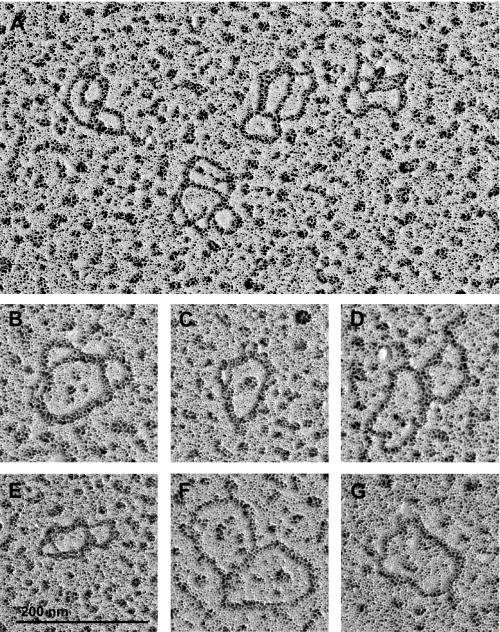
Kinetoplast DNA, the trypanosome mitochondrial genome, is a network of interlocked DNA rings including several thousand minicircles and a few dozen maxicircles. Minicircles replicate after release from the network, and their progeny reattach. Remarkably, trypanosomes have six mitochondrial DNA helicases related to yeast PIF1 helicase. Here we report that one of the six, TbPIF1, functions in minicircle replication. RNA interference (RNAi) of TbPIF1 causes a growth defect and kinetoplast DNA loss. Minicircle replication intermediates decrease during RNAi, and there is an accumulation of multiply interlocked, covalently closed minicircle dimers (fraction U). In studying the significance of fraction U, we found that this species also accumulates during RNAi of mitochondrial topoisomerase II. These data indicate that one function of TbPIF1 is an involvement, together with topoisomerase II, in the segregation of minicircle progeny.


Figures

FIGURE 1.
FIGURE 1.
Localization and enzymatic activity of TbPIF1. A, localization. Anti-Myc is in red, and DAPI is in green. Bar, 5 μm. B, left panel, SDS-PAGE of 1 μg of recombinant TbPIF1; the gel was stained with Coomassie Blue. Right panel, Western blot of TbPIF1 using anti-His antibody. C, ATPase assay of TbPIF1. Recombinant TbPIF1 was incubated (20-μl reaction, 10 min, 37 °C) with 8.25 nm [γ-32P]ATP (6000 Ci/mmol), 150 μm nonradioactive ATP, 50 mm Tris-HCl, pH 8.5, 50 mm NaCl, 2 mm dithiothreitol, 2 mm MgCl2, 0.25 mg/ml bovine serum albumin, and 50 ng of M13mp18 single-stranded DNA. The samples (1 μl) were spotted onto a polyethyleneimine-cellulose plate (J. T. Baker) and developed in 1.0 m formic acid, 0.5 m LiCl followed by autoradiography. The same amount of [γ-32P]ATP was converted to [32P]Pi by boiling 5 min in 1 m HCl; the [32P]Pi was used as a standard (left-most lane). D, helicase assay of TbPIF1. To make the substrate, a 36-mer oligonucleotide (5′-CGTAATCATGGTCATAGCTGTTTCCTGTGTGAAATT-3′) was 5′ end-labeled with [γ-32P]ATP and annealed to M13mp18 single-strand DNA circles. Recombinant TbPIF1 was incubated with 10 fmol of DNA in 20 μl of reaction buffer (50 mm Tris-HCl, pH 8.5, 50 mm NaCl, 2 mm dithiothreitol, 2 mm MgCl2, 2 mm ATP, 0.25 mg/ml bovine serum albumin) for 15 min at 37 °C. The reactions products were subjected to 12% polyacrylamide gel electrophoresis. The gel was dried and autoradiographed.
FIGURE 2.
FIGURE 2.
Effect of TbPIF1 RNAi on growth and kDNA size. A, effect of TbPIF1 RNAi on cell growth. The value of parasites/ml on the y axis is the measured value times the dilution factor. Inset, Northern blot showing level of TbPIF1 mRNA (∼3.5 kb) without or with RNAi. B, DAPI staining of cells with or without TbPIF1 RNAi (6 days). n, nucleus; k, kinetoplast. Bar, 5 μm. C, kinetics of kDNA loss as determined by visual analysis of DAPI-stained cells (>200 randomly selected cells were analyzed each day). D, electron micrographs of kDNA isolated from cells with (right panels) or without (left panel) TbPIF1 RNAi.
FIGURE 3.
FIGURE 3.
Effect of TbPIF1 RNAi on kDNA replication. A, effect of TbPIF1 RNAi on minicircle and maxicircle abundance. Total maxicircles (Maxi) and minicircles (Mini) were detected by probing a Southern blot after total DNA was digested with HindIII/XbaI followed by fractionation on an agarose gel. The maxicircle probe detects a 1.4-kb fragment, and the minicircle probe detects the 1.0-kb linearized minicircle (other minicircle fragments, arising from the heterogeneous minicircle population, declined during RNAi with the same kinetics observed with the 1-kb fragment). Hexose transporter genes, encoded by nuclear DNA, was probed as a loading control (Load). B, free minicircle analysis. Total DNA (106 cell equivalents/lane) was fractionated on a 1.5% agarose gel in TBE buffer (both the gel and running buffer contained 1 μg/ml ethidium bromide). Following transfer to the membrane, the blot was probed for minicircles. U, fraction U. C, sedimentation of free minicircle intermediates in a 5–20% sucrose gradient (34 ml) (6). Fractions (1 ml) were collected from the top, and 10 μl of each fraction (fractions 1–22, 24, 26, 28, 30, 32, and 34) were subjected to electrophoresis, and a Southern blot was probed for minicircles. D, quantitation of changes in level of free minicircle species as determined by scanning blots from Fig. 3C (fraction 8–22) with a PhosphorImager. The ratio of each free minicircle species to covalently closed minicircles (nicked/gapped (G/CC), multiply gapped (MG/CC), and fraction U (U/CC)) was determined for each time of RNAi. E, TdT labeling of isolated kDNA networks. kDNA was isolated during the course of an RNAi experiment and labeled with fluorescein-12-dUTP using terminal deoxyuridylate transferase followed by DAPI staining (35). Network a is TdT-negative and could be pre- or post-replication. Networks b and c are TdT-positive with polar labeling and are at early and later stages of replication, respectively. Network d is a uniformly TdT-labeled network, indicating that it has completed replication and is ready to segregate. Bar, 8 μm. F, more than 500 kDNA networks were quantified for TdT labeling. Polar, polar labeling; Full, full labeling; Ring, ring-shaped labeling.
FIGURE 4.
FIGURE 4.
Characterization of fraction U. A, total DNA from 3 × 10⁷ induced cells (3 days of RNAi) were fractionated on a neutral/alkaline two-dimensional agarose gel. The first dimension was in TBE buffer with 1 μg/ml ethidium bromide (TBE-EB) (conditions were same as those for the gel in Fig. 3B). The second dimension was in alkali (30 mm NaOH). Strand-specific oligonucleotide probes detected light strand (L strand) and heavy strand (H strand). U, fraction U; ccD, covalently closed dimer with single interlock. The scales below the panels indicated the sizes of alkali-denatured linear markers in the second dimension. B, gel-purified fraction U (from 2 × 10⁷ cells) was run on a 1.5% agarose gel with or without ethidium bromide (1 μg/ml) and detected by probing a Southern blot. Gel-purified N/G and CC minicircles were used as markers. C, gel-purified fraction U was treated with or without topoisomerase. The first three lanes contain markers: CC minicircles, N/G minicircles, and fraction U (U). The two right-hand lanes contain fraction U treated with human (H.s.) topoisomerase II (USB) and fraction U treated with E. coli (E.c.) topoisomerase I (NEB).
FIGURE 5.
FIGURE 5.
Electron micrographs of fraction U from TbPIF1 RNAi cells. A, relaxed minicircle monomer. B–L, fraction U dimers, which differ in number of interlocks. The arrows in I–L mark the small regions where individual double helices are visible. Bar, 500 nm.
FIGURE 6.
FIGURE 6.
Was fraction U derived from a kDNA network? kDNA and total DNA were isolated from TbPIF1 RNAi cells (3 days after induction). A, isolated kDNA (from 2 × 10⁷ cells) was subjected to a brief sonication, fractionated on an agarose gel with ethidium bromide, and detected by probing a Southern blot (36). B, total DNA (from 2 × 10⁶ cells) was fractionated for free minicircle analysis. U, fraction U.
FIGURE 7.
FIGURE 7.
Fraction U was formed after topoisomerase II RNAi. A, free minicircle analysis as in Fig. 3B except topoisomerase II was knocked down by RNAi. B, neutral/alkaline two-dimensional gel electrophoresis of free minicircles isolated from topoisomerase II RNAi cells (days 0–2). C, two-dimensional gels of free minicircles (also after RNAi for 2 days) as in B. Strand-specific hybridizations with synthetic oligonucleotide probes detected light strand (L strand) and heavy strand (H strand) of free minicircle species. U, fraction U. The scales below the panels indicate the sizes of linear markers in the second dimension.
FIGURE 8.
FIGURE 8.
Electron micrographs of fraction U from topoisomerase II RNAi cells. A, a field containing four fraction U dimers. B–F, enlarged images of fraction U dimers. G, relaxed minicircle monomer. Bar, 200 nm.

Similar articles

Cited by

References

    1. Shlomai J. (2004) Curr. Mol. Med. 4, 623–647 - PubMed
    1. Liu B., Liu Y., Motyka S. A., Agbo E. E., Englund P. T. (2005) Trends Parasitol. 21, 363–369 - PubMed
    1. Ogbadoyi E. O., Robinson D. R., Gull K. (2003) Mol. Biol. Cell 14, 1769–1779 - PMC - PubMed
    1. Simpson L., Aphasizhev R., Gao G., Kang X. (2004) RNA 10, 159–170 - PMC - PubMed
    1. Stuart K. D., Schnaufer A., Ernst N. L., Panigrahi A. K. (2005) Trends Biochem. Sci 30, 97–105 - PubMed

Publication types

MeSH terms

LinkOut - more resources