

Muscarinic acetylcholine receptor localization and activation effects on ganglion response properties
- PMID: 20042645
- PMCID: PMC2868487
- DOI: 10.1167/iovs.09-4771
Muscarinic acetylcholine receptor localization and activation effects on ganglion response properties
Abstract
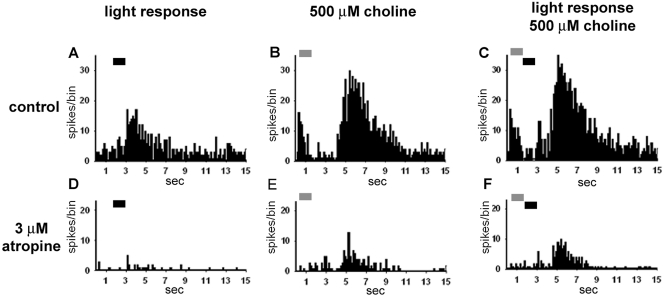
Purpose: The activation and blockade of muscarinic acetylcholine receptors (mAChRs) affects retinal ganglion cell light responses and firing rates. This study was undertaken to identify the full complement of mAChRs expressed in the rabbit retina and to assess mAChR distribution and the functional effects of mAChR activation and blockade on retinal response properties.
Methods: RT-PCR, Western blot analysis, and immunohistochemistry were used to identify the complement and distribution of mAChRs in the rabbit retina. Extracellular electrophysiology was used to determine the effects of the activation or blockade of mAChRs on ganglion cell response properties.
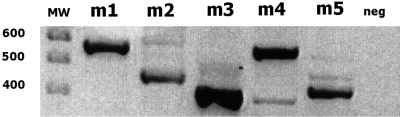
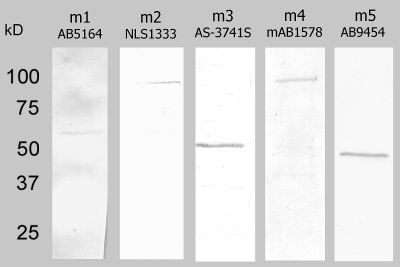
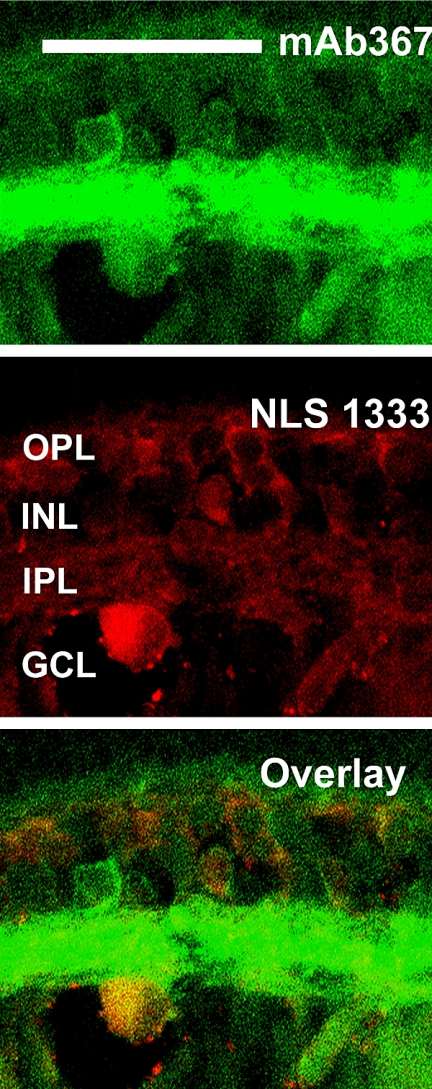
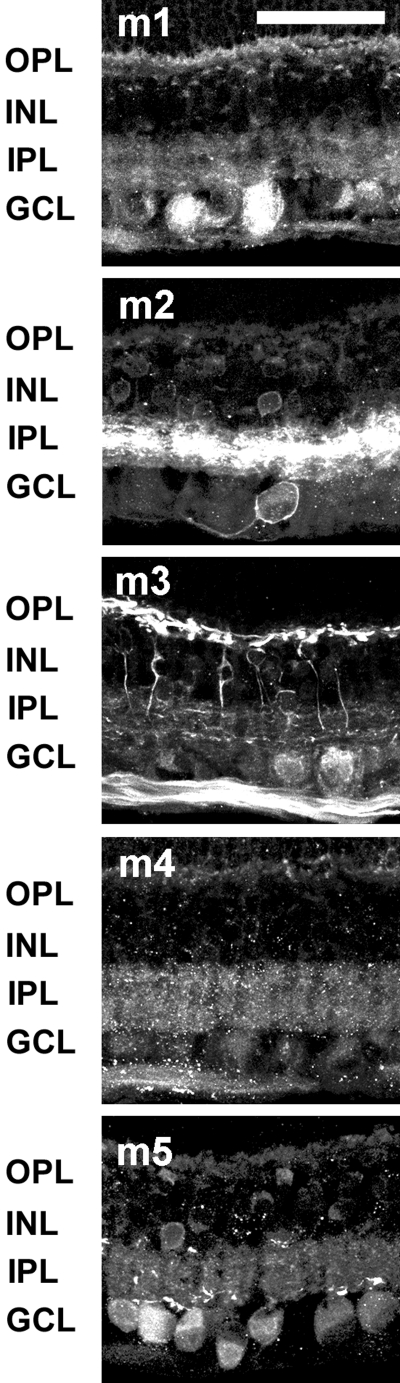
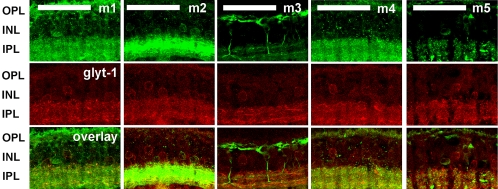
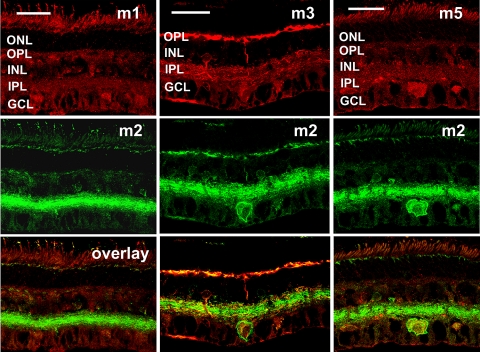
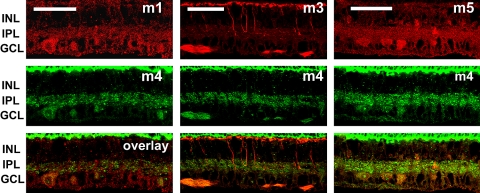
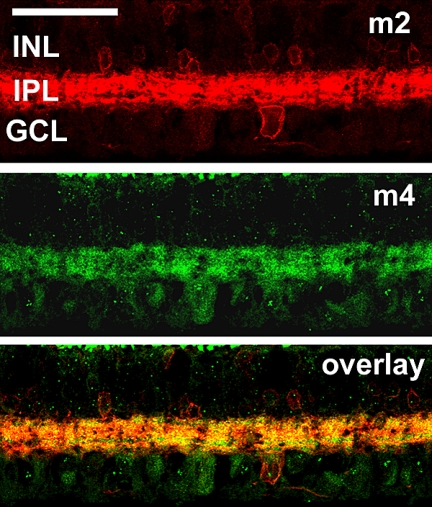
Results: RT-PCR of whole neural retina resulted in the amplification of mRNA transcripts for the m1 to m5 mAChR subtypes. Western blot and immunohistochemical analyses confirmed that all five mAChR subtypes were expressed by subpopulations of bipolar, amacrine, and ganglion cells in the rabbit retina, including subsets of cells in cholinergic and glycinergic circuits. Nonspecific muscarinic activation and blockade resulted in the class-specific modulation of maintained ganglion cell firing rates and light responses.
Conclusions: The expression of mAChR subtypes on subsets of bipolar, amacrine, and ganglion cells provides a substrate for both enhancement and suppression of retinal responses via activation by cholinergic agents. Thus, the muscarinic cholinergic system in the retina may contribute to the modulation of complex stimuli. Understanding the distribution and function of mAChRs in the retina has the potential to provide important insights into the visual changes that are caused by decreased ACh in the retinas of Alzheimer's patients and the potential visual effects of anticholinergic treatments for ocular diseases.
Figures


Similar articles
-
Acetylcholine receptors in the retinas of the α7 nicotinic acetylcholine receptor knockout mouse.Mol Vis. 2014 Sep 20;20:1328-56. eCollection 2014. Mol Vis. 2014. PMID: 25352741 Free PMC article.
-
Nicotinic and muscarinic acetylcholine receptors shape ganglion cell response properties.J Neurophysiol. 2015 Jan 1;113(1):203-17. doi: 10.1152/jn.00405.2014. Epub 2014 Oct 8. J Neurophysiol. 2015. PMID: 25298382 Free PMC article.
-
Rabbit retinal ganglion cells express functional alpha7 nicotinic acetylcholine receptors.Am J Physiol Cell Physiol. 2005 Sep;289(3):C644-55. doi: 10.1152/ajpcell.00633.2004. Epub 2005 May 4. Am J Physiol Cell Physiol. 2005. PMID: 15872006
-
Muscarinic Acetylcholine Receptors in the Retina-Therapeutic Implications.Int J Mol Sci. 2021 May 8;22(9):4989. doi: 10.3390/ijms22094989. Int J Mol Sci. 2021. PMID: 34066677 Free PMC article. Review.
-
Cellular signaling mechanisms for muscarinic acetylcholine receptors.Recept Channels. 2003;9(4):241-60. Recept Channels. 2003. PMID: 12893537 Review.
Cited by
-
Effect of the M1 Muscarinic Acetylcholine Receptor on Retinal Neuron Number Studied with Gene-Targeted Mice.J Mol Neurosci. 2015 Jun;56(2):472-9. doi: 10.1007/s12031-015-0524-7. Epub 2015 Feb 28. J Mol Neurosci. 2015. PMID: 25720339
-
Temporal integration of light flashes by the human circadian system.J Clin Invest. 2016 Mar 1;126(3):938-47. doi: 10.1172/JCI82306. Epub 2016 Feb 8. J Clin Invest. 2016. PMID: 26854928 Free PMC article. Clinical Trial.
-
Starburst amacrine cells amplify optogenetic visual restoration through gap junctions.Mol Ther Methods Clin Dev. 2023 May 12;30:1-13. doi: 10.1016/j.omtm.2023.05.011. eCollection 2023 Sep 14. Mol Ther Methods Clin Dev. 2023. PMID: 37324975 Free PMC article.
-
Characterization of ex vivo cultured neuronal- and glial- like cells from human idiopathic epiretinal membranes.BMC Ophthalmol. 2014 Dec 23;14:165. doi: 10.1186/1471-2415-14-165. BMC Ophthalmol. 2014. PMID: 25540050 Free PMC article.
-
Pharmacologically stimulated pupil and accommodative changes in Guinea pigs.Invest Ophthalmol Vis Sci. 2014 Aug 5;55(8):5456-65. doi: 10.1167/iovs.14-14096. Invest Ophthalmol Vis Sci. 2014. PMID: 25097245 Free PMC article.
References
-
- Schmidt M, Humphrey MF, Wassle H. Action and localization of acetylcholine in the cat retina. J Neurophysiol 1987;58:997–1015 - PubMed
-
- Costa LG, Murphy SD. Interaction of choline with nicotinic and muscarinic cholinergic receptors in the rat brain in vitro. Clin Exp Pharmacol Physiol 1984;11:649–654 - PubMed
-
- Strenn K, Dal-Bianco P, Weghaupt H, Koch G, Vass C, Gottlob I. Pattern electroretinogram and luminance electroretinogram in Alzheimer's disease. J Neural Transm Suppl 1991;33:73–80 - PubMed
-
- Daniels R, Harding GF, Anderson SJ. Effect of dopamine and acetylcholine on the visual evoked potential. Int J Psychophysiol 1994;16:251–261 - PubMed
Publication types
MeSH terms
Substances
Grants and funding
LinkOut - more resources
Full Text Sources
