. 2010 Mar;298(3):R642-60.
doi: 10.1152/ajpregu.00729.2009. Epub 2009 Dec 30.

A SLC4-like anion exchanger from renal tubules of the mosquito (Aedes aegypti): evidence for a novel role of stellate cells in diuretic fluid secretion

Affiliations

A SLC4-like anion exchanger from renal tubules of the mosquito (Aedes aegypti): evidence for a novel role of stellate cells in diuretic fluid secretion

Peter M Piermarini et al. Am J Physiol Regul Integr Comp Physiol. 2010 Mar.

Abstract

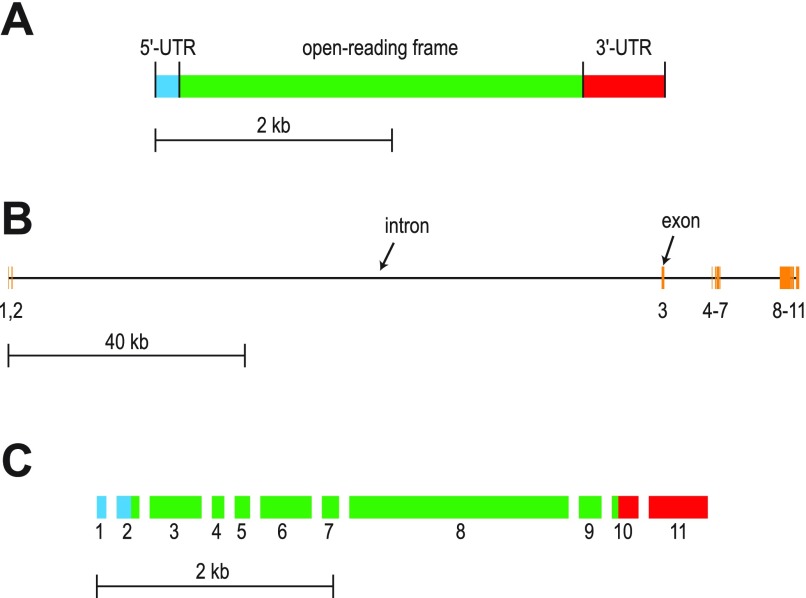
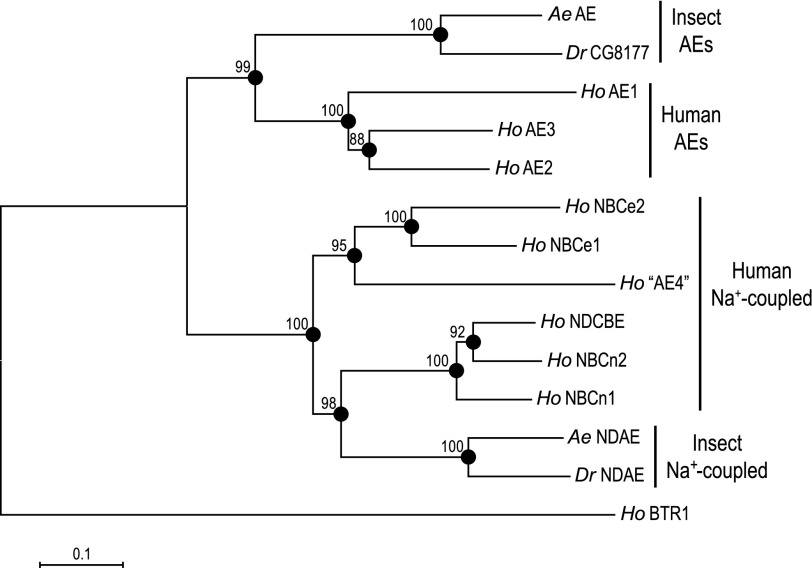
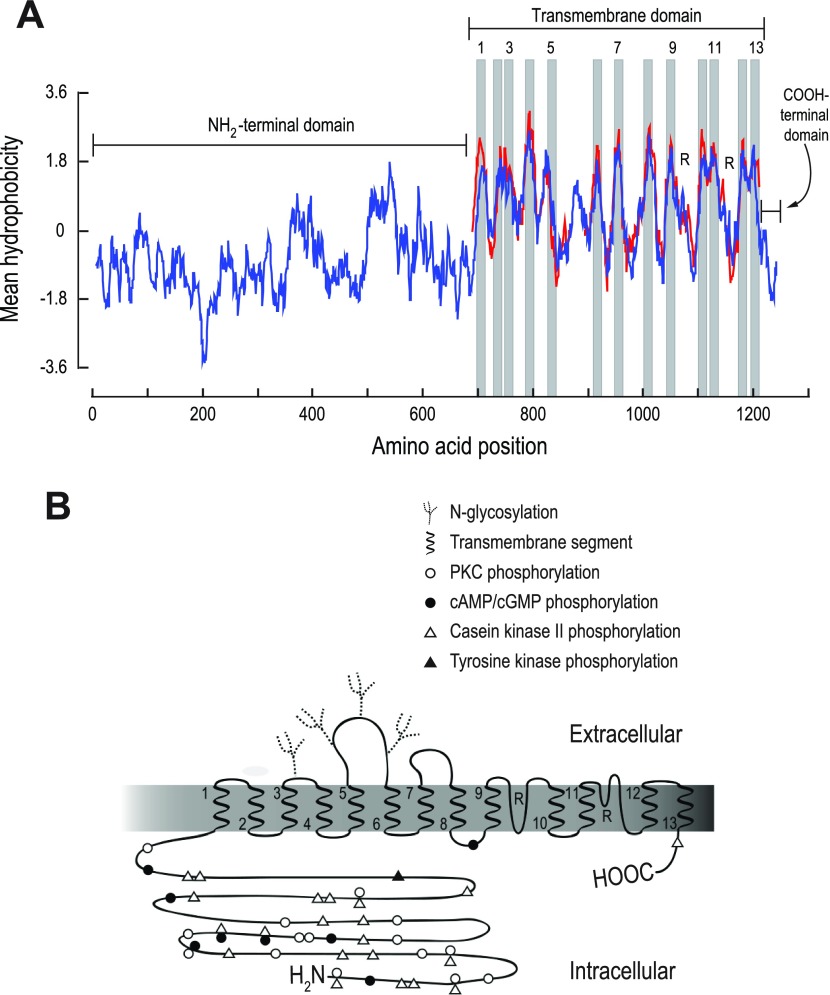
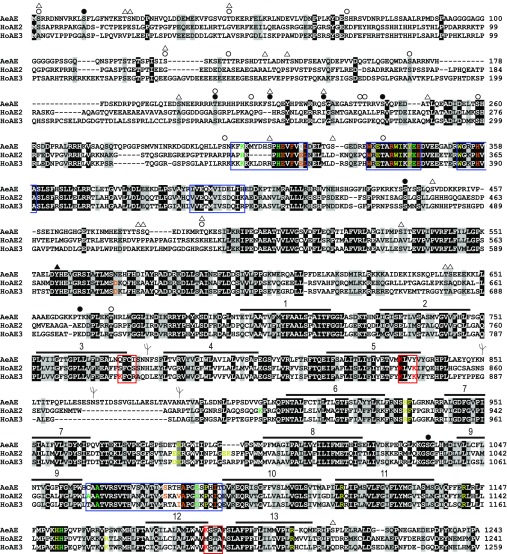
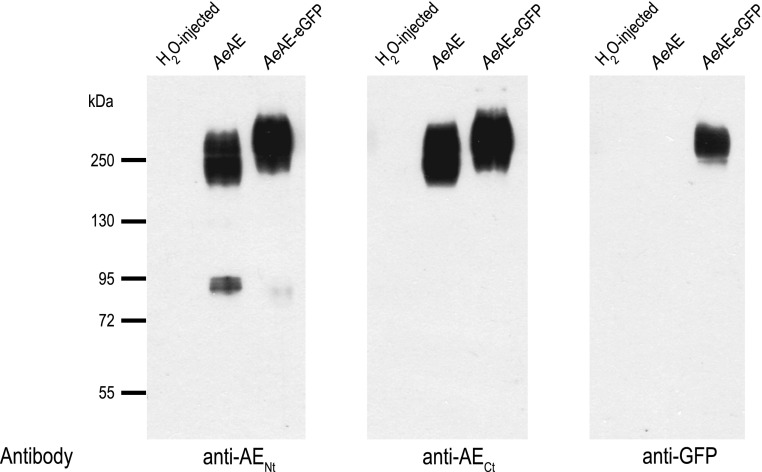
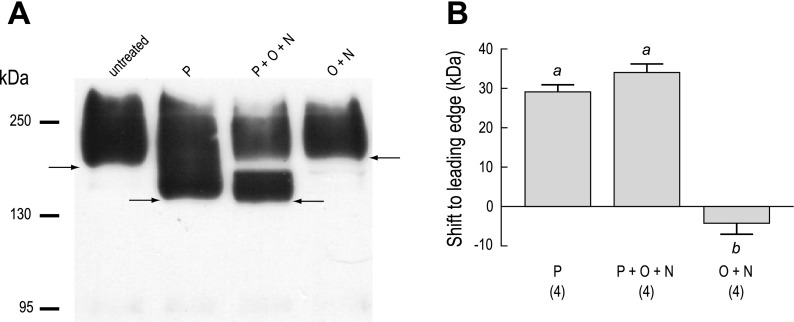
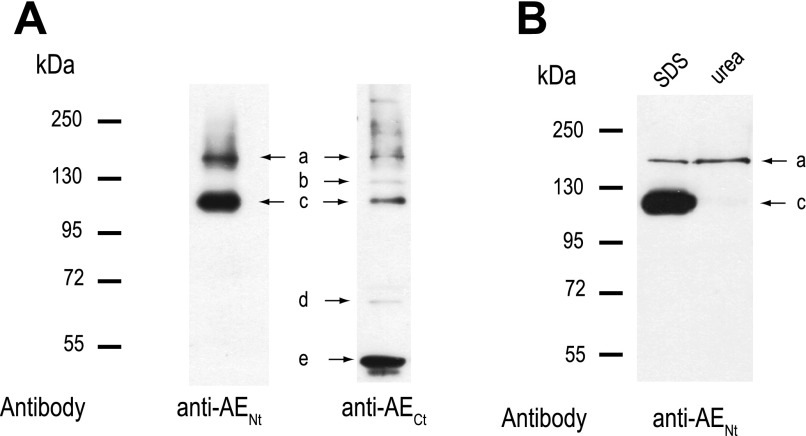
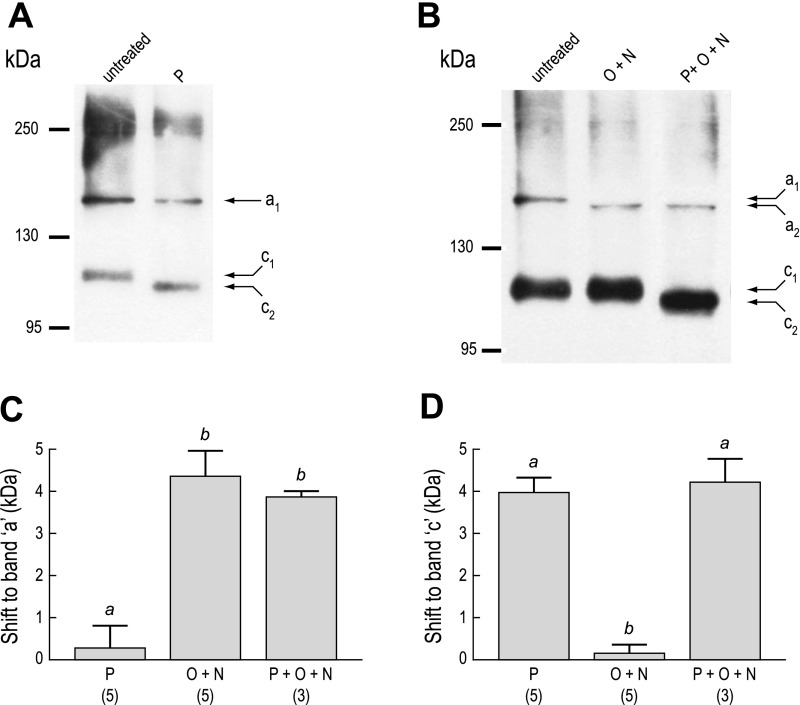
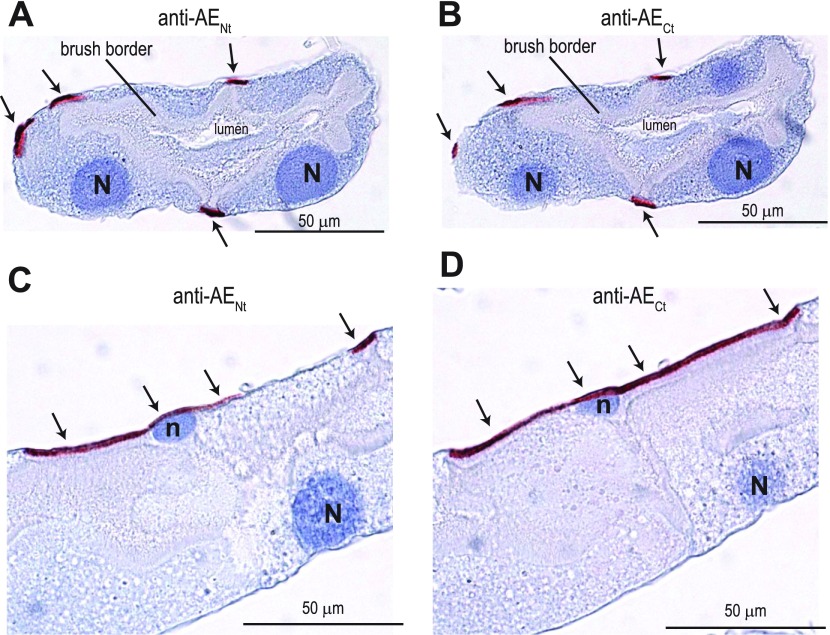
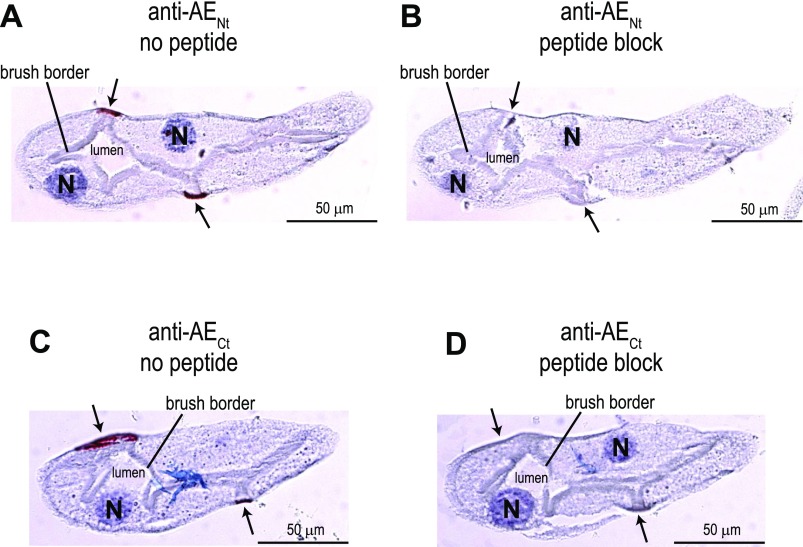
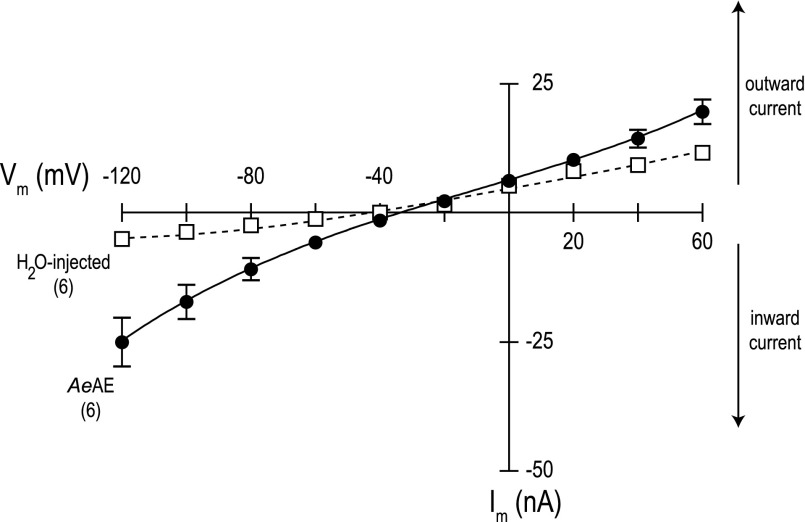
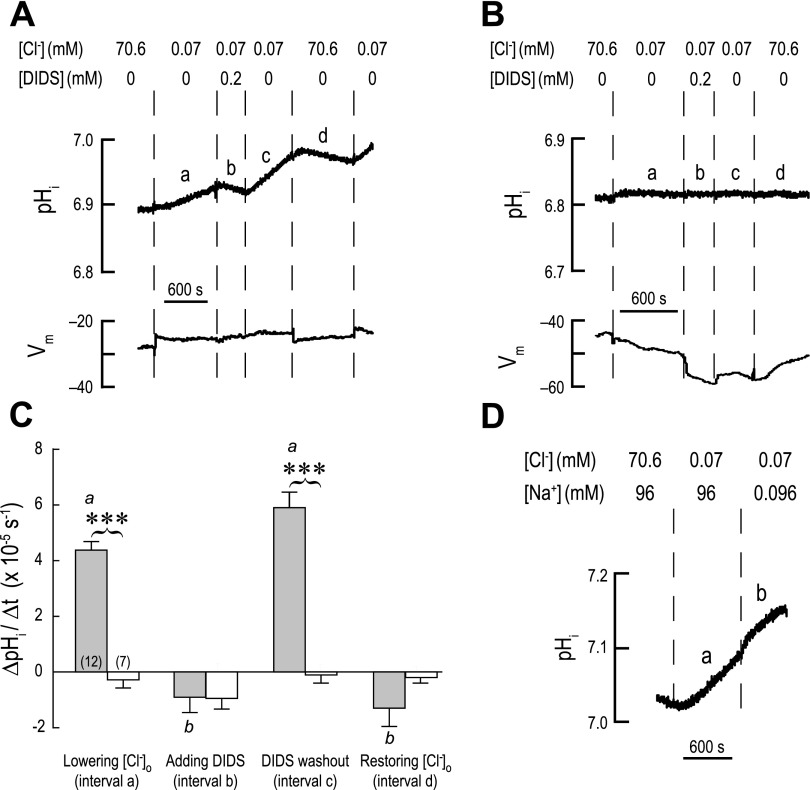
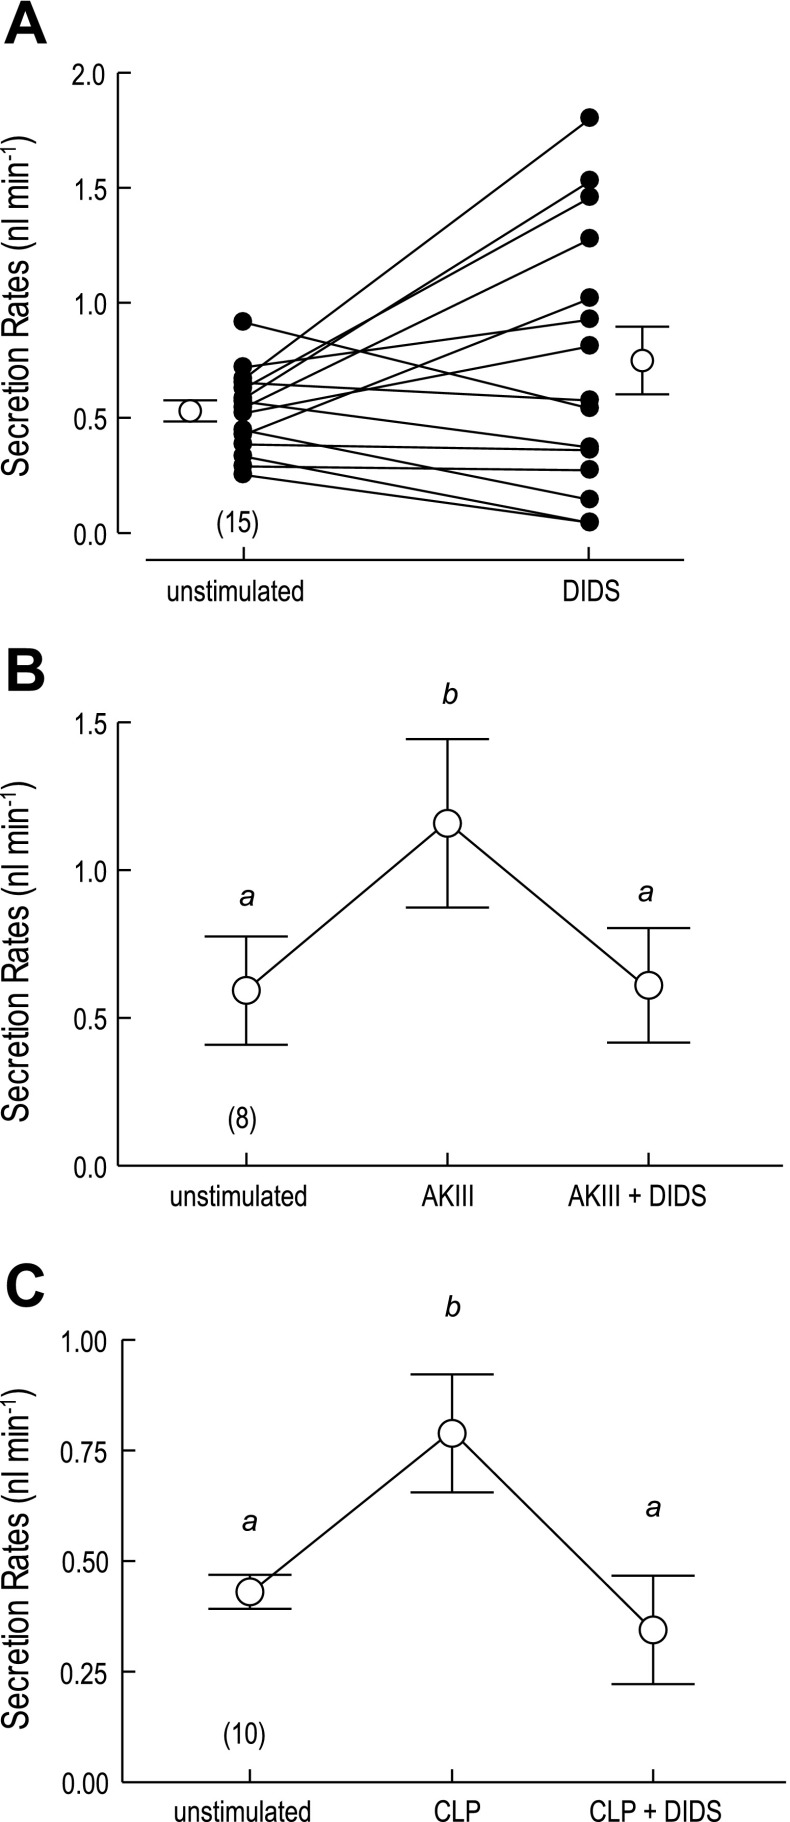
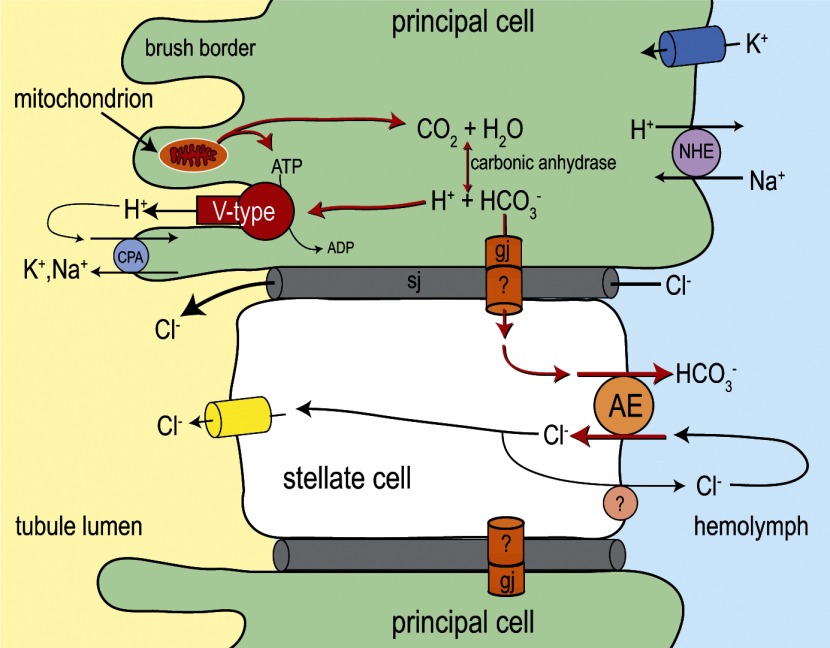
Transepithelial fluid secretion across the renal (Malpighian) tubule epithelium of the mosquito (Aedes aegypti) is energized by the vacuolar-type (V-type) H(+)-ATPase and not the Na(+)-K(+)-ATPase. Located at the apical membrane of principal cells, the V-type H(+)-ATPase translocates protons from the cytoplasm to the tubule lumen. Secreted protons are likely to derive from metabolic H(2)CO(3), which raises questions about the handling of HCO(3)(-) by principal cells. Accordingly, we tested the hypothesis that a Cl/HCO(3) anion exchanger (AE) related to the solute-linked carrier 4 (SLC4) superfamily mediates the extrusion of HCO(3)(-) across the basal membrane of principal cells. We began by cloning from Aedes Malpighian tubules a full-length cDNA encoding an SLC4-like AE, termed AeAE. When expressed heterologously in Xenopus oocytes, AeAE is both N- and O-glycosylated and mediates Na(+)-independent intracellular pH changes that are sensitive to extracellular Cl(-) concentration and to DIDS. In Aedes Malpighian tubules, AeAE is expressed as two distinct forms: one is O-glycosylated, and the other is N-glycosylated. Significantly, AeAE immunoreactivity localizes to the basal regions of stellate cells but not principal cells. Concentrations of DIDS that inhibit AeAE activity in Xenopus oocytes have no effects on the unstimulated rates of fluid secretion mediated by Malpighian tubules as measured by the Ramsay assay. However, in Malpighian tubules stimulated with kinin or calcitonin-like diuretic peptides, DIDS reduces the diuretic rates of fluid secretion to basal levels. In conclusion, Aedes Malpighian tubules express AeAE in the basal region of stellate cells, where this transporter may participate in producing diuretic rates of transepithelial fluid secretion.


Figures

Fig. 1.
Fig. 1.
Maps of the cDNA cloned from Aedes Malpighian tubules that encodes a putative AE (designated AeAE cDNA) and the AeAE gene. A: map of the AeAE cDNA showing the relative lengths of the 5′-untranslated region (UTR; blue), open reading frame (green), and 3′-UTR (red). B: map of the AeAE gene showing the distribution of the exons (orange vertical bars). Exon numbers are indicated. Horizontal black bars represent introns. Exact genomic positions and/or lengths of the exons and introns are listed in Table 3. C: fractured map of the AeAE cDNA showing how each exon contributes to the features and length of the cDNA shown in A.
Fig. 2.
Fig. 2.
Phylogenetic relationship of AeAE to other SLC4 proteins. A neighbor-joining phylogenetic tree of selected insect (Aedes, Ae; Drosophila, Dr) and human (Ho) SLC4 proteins. The tree was generated with MEGA 4 software (77) using Poisson-corrected distance estimates. The nodes of branches are indicated by filled circles for which bootstrap scores (from 1,000 replicates) are provided. The total branch length between 2 proteins represents the proportion of amino acids that differ between them. The scale bar represents a branch length that corresponds to a proportional difference of 0.1 (i.e., a 10% difference in amino acids). Human BTR1 (HoBTR1, SLC4A11) is the outgroup. Accession numbers are as follows: AeAE, EU700988; AeNDAE, ACH96582; DrCG8177, NP_996034; DrNDAE, NP_723263.2; HoAE1, AAH99628; HoAE2, EAW54048; HoAE3, AAI46657; Ho“AE4”, NP_113655; HoBTR1, NP_114423; HoNBCe1, NP_001128214; HoNBCe2, NP_067019; HoNBCn1, ACH61961; HoNBCn2, BAB18301; HoNDCBE, ABJ09587.
Fig. 3.
Fig. 3.
Predicted membrane topology of the AeAE protein. A: Kyte-Doolittle hydropathy plots (window size = 15) of AeAE (blue trace) and the transmembrane (TM) domain of human AE1 (red trace) as generated and aligned using BioEdit Sequence Alignment Editor software, version 7 (24). Breaks in the red trace represent gaps introduced by the sequence alignment. Shaded regions are predicted TM segments, for which every other is numbered. R, predicted reentrant loops. B: hypothesized topology map of AeAE based on hydropathy plot in A and the experimentally derived topology of human AE1 (13, 93, 94). The TM segments are numbered at their emerging ends. Putative posttranslational modifications and regulatory sites are also indicated (see text and Fig. 4 for details).
Fig. 4.
Fig. 4.
Annotated amino acid sequence of AeAE. The amino acids of AeAE (accession no. EU700988) were aligned with those of human AE2 (HoAE2; accession no. AAC50964.1) and human AE3 (HoAE3; accession no. NP_963868.2) using the ClustalW algorithm (38). The residue shading was performed using BioEdit Sequence Alignment Editor software, version 7 (24), with a threshold of 100%, where black shading indicates identical residues and gray shading indicates similar residues. Numbered horizontal bars identify the regions of predicted TM segments that are depicted in Fig. 3. The red boxes at the ends of TM segments 3, 5, and 12 outline regions that contain lysine residues (in red) associated with sensitivity to stilbene derivates such as DIDS. The 4 blue boxes (3 in the NH2-terminal domain and 1 between TM segments 9 and 10) outline regions associated with the sensitivity of murine AE2 to intracellular (pHi) and/or extracellular pH (pHo). Specific residues (within and outside the blue boxes) that are involved with the regulation of AE2 by pH are colored as follows: green, involved with regulation by pHo; yellow, involved with regulation by pHi; orange, involved with regulation by pHo and pHi. The corresponding residues of AeAE and HoAE3 are colored identically if they are conserved (i.e., identity, charge, or hydrophobicity). Symbols are as defined in Fig. 3B. Data on pH sensitivity are from Refs. and –.
Fig. 5.
Fig. 5.
Heterologous expression of AeAE in Xenopus oocytes. Western blots of total membrane fractions isolated from Xenopus oocytes 6 days after injection with H2O, AeAE cRNA (28 ng), or AeAE-enhanced green fluorescent protein (eGFP) cRNA (28 ng). The antibodies used against the NH2 (anti-AENt)- and COOH-terminal (anti-AECt) AeAE peptides and GFP are indicated. Migrations of the molecular mass markers (in kDa) are indicated at left.
Fig. 6.
Fig. 6.
Glycosylation of heterologously expressed AeAE in Xenopus oocytes. A: Western blot of total membrane fractions isolated from AeAE oocytes (6 days postinjection). The membrane fractions were either untreated or exposed to one of the following enzymatic treatments: 1) PNGase F (P); 2) a mixture of PNGase F, O-glycosidase, and neuraminidase (P + O + N); or 3) a mixture of O-glycosidase and neuraminidase (O + N). The anti-AENt antibody was used to detect AeAE immunoreactivity. Arrows indicate the leading edge of the immunoreactivity. Migrations of the molecular mass markers (in kDa) are indicated at left. B: summary of the effects of enzymatic deglycosylation on the migration of the AeAE immunoreactivity. Shaded bars represent the shift (in kDa) to the leading edge. Values are means ± SE based on the number of measurements shown in parentheses. a,bP < 0.001, categorization of the means as determined by a repeated-measures ANOVA and Newman-Keuls posttest.
Fig. 7.
Fig. 7.
Expression of AeAE immunoreactivity in female Aedes Malpighian tubules. A: representative Western blots of total membrane protein (30 μg/lane) isolated from Malpighian tubules of adult Aedes females. Labeled arrows indicate the protein bands (a–e) displaying AeAE immunoreactivity. The antibodies used are indicated. Migrations of the molecular mass markers (in kDa) are indicated at left. B: representative Western blot of anti-AENt immunoreactivity in crude Malpighian tubule lysates (30 μg protein/lane) denatured under standard Laemmli (SDS) or high-urea conditions.
Fig. 8.
Fig. 8.
Glycosylation of AeAE in female Aedes Malpighian tubules. Western blots were performed using crude lysates from Malpighian tubules of adult Aedes females. A: lysates were either untreated or exposed to PNGase F (P). B: lysates were either untreated or exposed to one of the following enzymatic treatments: 1) O + N or 2) P + O + N. The anti-AENt antibody was used to detect AeAE immunoreactivity. Labeled arrows indicate the migrations of bands a and c; migrations of the molecular mass markers (in kDa) are indicated at left. In both A and B, diffuse immunoreactivity of ∼250 kDa appears, which may represent aggregates of the AeAE protein. C: summary of the effects of enzymatic deglycosylation on the migration of band a. Shaded bars represent the shift (in kDa) to band a. Values are means ± SE based on the number of measurements shown in parentheses. a,bP < 0.01, categorization of the means as determined by a 1-way ANOVA and Newman-Keuls posttest. D: same experiment described in C, but for band c.
Fig. 9.
Fig. 9.
Localization of AeAE immunoreactivity in consecutive sections of female Aedes Malpighian tubules. Representative immunoperoxidase labeling of AeAE is shown in isolated Malpighian tubules from adult Aedes females. The antibodies used are indicated. The sections in A and B are from the same Malpighian tubule, taken 4 μm apart, and provide transverse sections through the armlike projections of stellate cells; the sections in C and D are as described in A and B but provide longitudinal sections through the armlike projections of a stellate cell. The arrows indicate red staining associated with the immunolabeling. The blue counterstain (hematoxylin) labels nuclei and provides contrast. N, the nucleus of a principal cell; n, the nucleus of a stellate cell.
Fig. 10.
Fig. 10.
Effect of antibody preadsorption on AeAE immunolabeling in consecutive sections of Aedes Malpighian tubules. Representative immunoperoxidase labeling of AeAE is shown in isolated Malpighian tubules from adult Aedes females. The antibodies used and the presence of immunogenic peptides are indicated. The sections in A and B are from the same Malpighian tubule, taken 4 μm apart; the sections in C and D are likewise. In A and C, the arrows indicate red staining associated with the immunolabeling. In B and D, the arrows indicate the cells that are stained in A and C, respectively. The blue counterstain (hematoxylin) labels nuclei and provides contrast.
Fig. 11.
Fig. 11.
Current-voltage (I-V) plots of AeAE and H2O-injected oocytes. Negative Im values represent the net movement of positive charge into or negative charge out of the cell (inward current), whereas positive Im values represent outward current. Data were acquired in a normal Cl solution with nominal CO2/HCO3 (solution I, Table 2). Values are means ± SE based on the number of oocytes shown in parentheses. Missing error bars indicate values too small to illustrate. The dashed line connecting open boxes represents the I-V relationship of the H2O-injected oocytes, whereas the solid line connecting filled circles represents the I-V relationship of the AeAE oocytes.
Fig. 12.
Fig. 12.
Cl dependence, DIDS sensitivity, and Na+ independence of intracellular alkalinization in AeAE oocytes. A: representative recordings of pHi and membrane potential (Vm) in an AeAE oocyte exposed to a 5% CO2/33 mM HCO3 solution (solution III, Table 2) for 2 h prior. Extracellular concentrations (in mM) of Cl and DIDS are indicated. When extracellular [Cl] was lowered, it was replaced by gluconate. Solution changes are indicated by dashed vertical lines. Intervals a–d in the pHi trace indicate the intervals where rates of pHi change (ΔpHit) were measured. B: representative recordings of pHi and Vm in a H2O-injected oocyte, using a protocol similar to that described in A. C: summary of ΔpHit measurements. Shaded bars represent ΔpHit values of AeAE oocytes (number of oocytes shown in parentheses) during the intervals identified in A. The open bars represent H2O-injected oocytes at similar intervals. Values are means ± SE. Brackets connecting shaded and open bars represent comparisons in unpaired t-tests resulting in significant differences (***P < 0.001). a,bP < 0.001, categorization of the means of the AeAE oocytes as determined by a repeated-measures ANOVA and Newman-Keuls posttest. D: representative recording of pHi in an AeAE oocyte that examines the Na+ dependence of AeAE transport. Extracellular concentrations (in mM) of Cl and Na+ are indicated. A total of 6 AeAE oocytes were evaluated using this protocol.
Fig. 13.
Fig. 13.
Effects of DIDS on fluid secretion rates of isolated Aedes Malpighian tubules. A: effect of 200 μM DIDS in unstimulated Malpighian tubules. Lines connect control (unstimulated) and experimental (DIDS) data (filled circles) of each tubule for paired comparisons. Transepithelial fluid secretion rates were measured in the absence and presence of DIDS for 30 min each. Open circles indicate mean (±SE) secretion rates. The number of paired tubule measurements is shown in parenthesis. B: effect of 200 μM DIDS on the diuresis stimulated by aedeskinin III (AKIII; 10−6 M). Each Malpighian tubule was first studied for 30 min under unstimulated conditions, then in the presence of AKIII, and finally in the presence of AKIII and DIDS. C: effect of 200 μM DIDS on the diuresis stimulated by Anopheles calcitonin-like peptide (CLP; 10−6 M) following the experimental protocol in B. a,bP < 0.01, categorization of the means as determined by a repeated-measures ANOVA and Newman-Keuls posttest.
Fig. 14.
Fig. 14.
Hypothesized metabolic model of stellate cell function in Aedes Malpighian tubules. The illustration shows a stellate cell intercalated between 2 principal cells. As emphasized by the red arrows, we propose that AeAE contributes primarily to the handling of intracellular HCO3 that is generated by the mitochondrial metabolism of principal cells during diuretic conditions. AeAE also may contribute to a transcellular pathway for Cl secretion, but this is considered a minor role (see text for details). A recycling mechanism for Cl across the basal membrane of stellate cells cannot be ruled out. Principal and stellate cells are shown to be connected via 1) paracellular septate junctions (sj), which provide the primary pathway for transepithelial Cl secretion (3), and 2) intercellular gap junctions (gj), which provide a putative pathway for the transport of HCO3 to stellate cells. Previous studies in mosquito Malpighian tubules have shown evidence of an apical V-type H+-ATPase in the brush border of principal cells (52, 86), a carbonic anhydrase in principal cells (67), gap junctions in principal cells (87), basal K+ channels in principal cells (6), a basal Na/H exchanger (NHE) in principal cells (53, 57), and apical Cl channels in stellate cells (45). The molecular identity of the apical cation/H+ antiporter (CPA) has yet to be identified (56). See Ref. for a detailed review of the transepithelial transport mechanisms in mosquito Malpighian tubules.

Similar articles

Cited by

References

    1. Alper SL. Molecular physiology and genetics of Na+-independent SLC4 anion exchangers. J Exp Biol 212: 1672–1683, 2009. - PMC - PubMed
    1. Beyenbach KW. Energizing epithelial transport with the vacuolar H+-ATPase. News Physiol Sci 16: 145–151, 2001. - PubMed
    1. Beyenbach KW. Regulation of tight junction permeability with switch-like speed. Curr Opin Nephrol Hypertens 12: 543–550, 2003. - PubMed
    1. Beyenbach KW. Transport mechanisms of diuresis in Malpighian tubules of insects. J Exp Biol 206: 3845–3856, 2003. - PubMed
    1. Beyenbach KW, Baumgart S, Lau K, Piermarini PM, Zhang S. Signaling to the apical membrane and to the paracellular pathway: changes in the cytosolic proteome of Aedes Malpighian tubules. J Exp Biol 212: 329–340, 2009. - PMC - PubMed

Publication types

MeSH terms

Substances