. 2010 Mar;103(3):1478-89.
doi: 10.1152/jn.00664.2009. Epub 2009 Dec 30.

Frequency-velocity mismatch: a fundamental abnormality in parkinsonian gait

Affiliations

Frequency-velocity mismatch: a fundamental abnormality in parkinsonian gait

Catherine Cho et al. J Neurophysiol. 2010 Mar.

Abstract

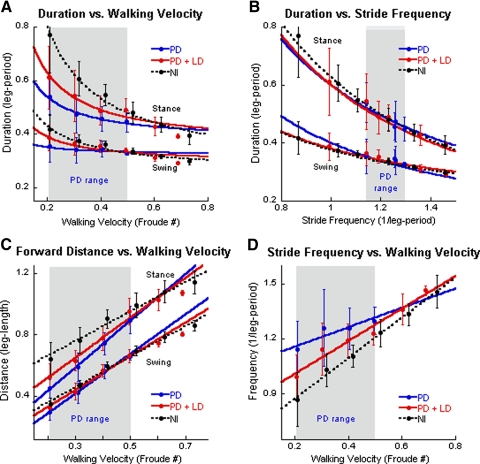
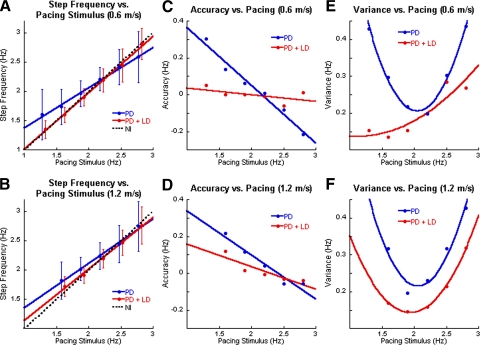
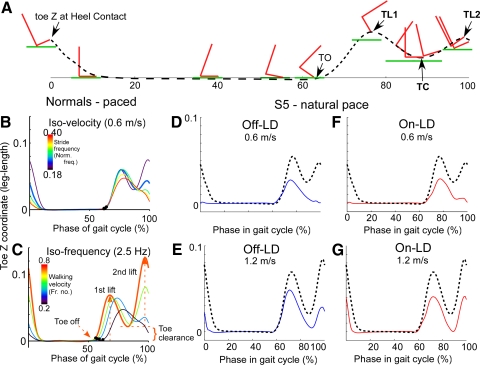
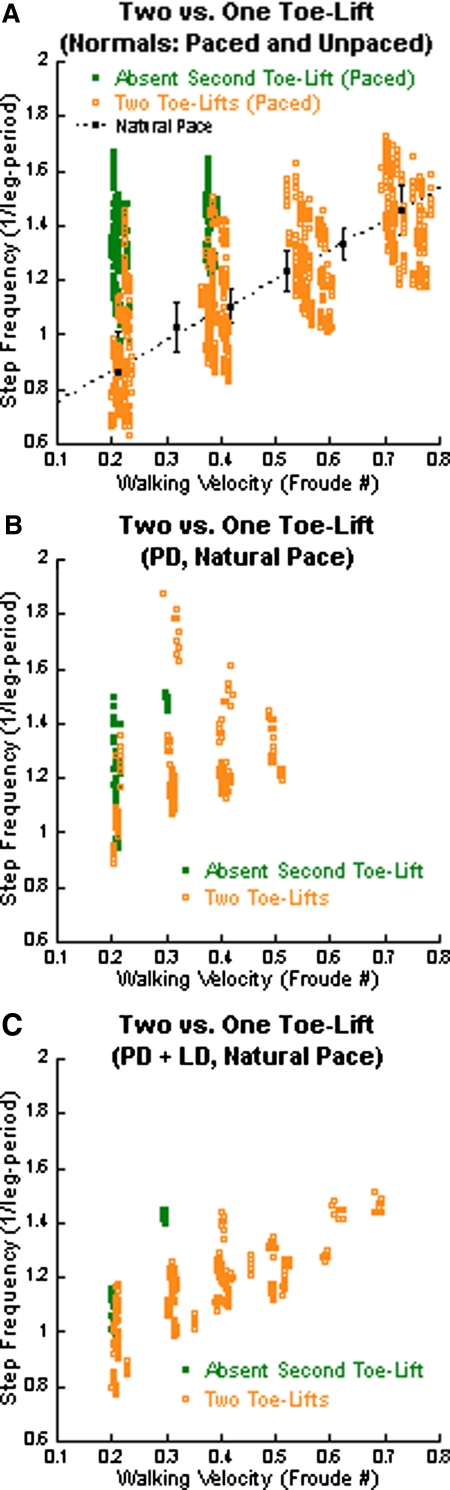
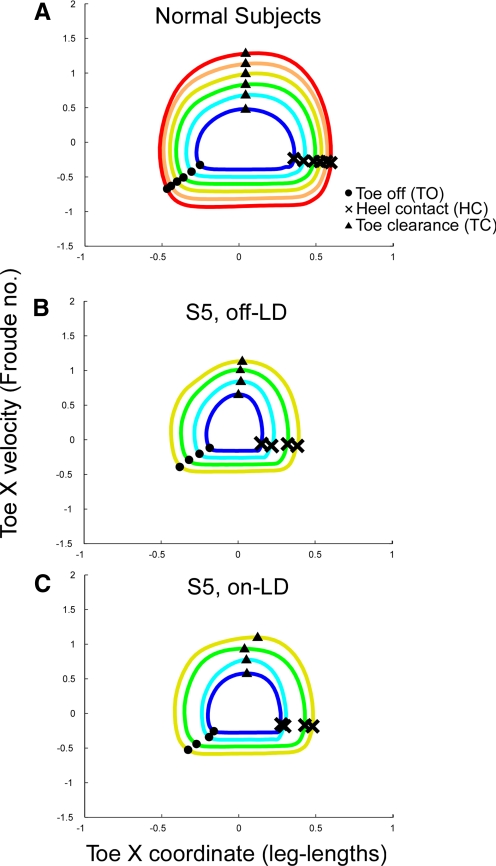
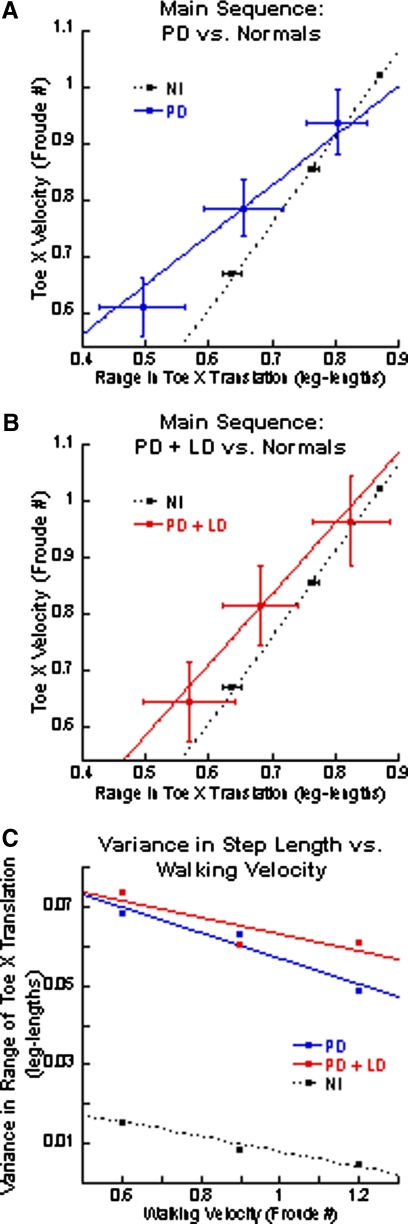
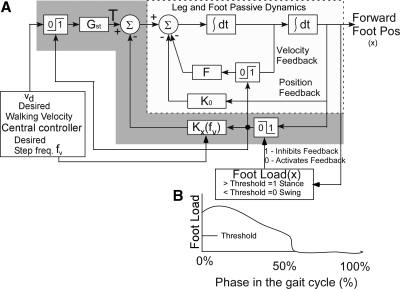
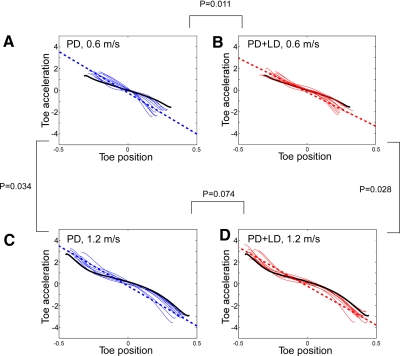
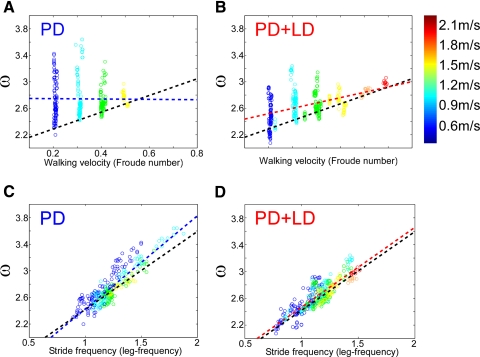
Gait dysfunction and falling are major sources of disability for patients with advanced Parkinson's disease (PD). It is presently thought that the fundamental defect is an inability to generate normal stride length. Our data suggest, however, that the basic problem in PD gait is an impaired ability to match step frequency to walking velocity. In this study, foot movements of PD and normal subjects were monitored with an OPTOTRAK motion-detection system while they walked on a treadmill at different velocities. PD subjects were also paced with auditory stimuli at different frequencies. PD gait was characterized by step frequencies that were faster and stride lengths that were shorter than those of normal controls. At low walking velocities, PD stepping had a reduced or absent terminal toe lift, which truncated swing phases, producing shortened steps. Auditory pacing was not able to normalize step frequency at these lower velocities. Peak forward toe velocities increased with walking velocity and PD subjects could initiate appropriate foot dynamics during initial phases of the swing. They could not control the foot appropriately in terminal phases, however. Increased treadmill velocity, which matched the natural PD step frequency, generated a second toe lift, normalizing step size. Levodopa increased the bandwidth of step frequencies, but was not as effective as increases in walking velocity in normalizing gait. We postulate that the inability to control step frequency and adjust swing phase dynamics to slower walking velocities are major causes for the gait impairment in PD.


Figures

Fig. 1.
Fig. 1.
Analysis of gait as a function of walking velocity and stride frequency in Parkinson's disease (PD), PD + levodopa (LD), and in normal subjects. A: duration of stance and swing phases vs. walking velocity. In this and in subsequent figures, the blue symbols and lines represent data from PD subjects without medication, the red symbols and lines represent data from PD subjects with LD (see methods for details), and the black symbols and dotted lines represent data from normal subjects. The filled circles are means and the vertical lines ±1SD. The gray areas show the range of data from the PD subjects off LD. B: duration of stance and swing phases vs. stride frequency. C: distance covered in stance and swing phases as a function of walking velocity. D: stride frequency as a function of walking velocity. The top 3 traces represent stance phases and the bottom 3 traces represent swing phases in A–C.
Fig. 2.
Fig. 2.
A and B: step frequency (ordinate) as a function of auditory pacing stimulus (abscissa) when walking at 0.6 m/s (A, C, E) and at 1.2 m/s (B, D, F). As in Fig. 1, the blue and red symbols represent data from PD subjects off and on LD, and the black-dotted lines in A and B represent data from normal subjects. Filled circles and error bars are means ± 1SD. C and D: accuracy of stepping (ordinate) as a function of the pacing stimulus (abscissa). E and F: variance as a function of auditory pacing.
Fig. 3.
Fig. 3.
A: pictorial representation of X-axis and Z-axis translation of the foot and toe (red) relative to the walking surface (green) during the stride cycle. The stance phase begins when the toe is elevated from the surface and the foot makes heel contact (0%). TO, toe off; TL1, first toe lift; TC, toe clearance; TL2, second toe lift. The black dashed line shows the trajectory of the toe at various phases of the stride cycle. B, D, and F: Toe-Z variation over the stride cycle during auditory pacing at different frequencies while walking at a constant velocity of 0.6 m/s in normal subjects (B), PD subjects off (D) and on LD (F). The bar on the left of the graph in B is a color representation of step frequency with lower frequencies shown as purple and higher shown as red. The black-dotted lines in D and F are from normal subjects, shown for comparison. Note the absence of the second toe lift in normal subjects in B, when the step frequency was high, and the absent second toe lift in D and F when PD subjects walked at 0.6 m/s. C, E, and G: Toe-Z variation over the stride cycle while normal subjects (C) walked at different velocities at a constant step frequency of 2.5 Hz. The bar on the left of the graph in C is a color representation of walking velocity with lower velocities shown as purple and higher shown as red. E and G: at 1.2 m/s, the PD subjects off (E) and on LD (G) had a second toe lift. The black-dotted lines represent data from normal subjects walking at 1.2 m/s.
Fig. 4.
Fig. 4.
Absence of the second toe lift as a function of the frequency-velocity dissociation. The green solid circles represent gait cycles without the second toe lift and the orange open circles represent gait cycles with 2 toe lifts. A: paced data for normal subjects (green and orange circles). The black circles and error bars represent the mean ± SD of data from normal subjects at their natural pace. The black-dotted line is the linear regression. Note the loss of the second toe lift at higher frequencies of pacing at lower walking velocities. B: loss of second toe lift in PD subjects walking at their natural pace (green dots) and reappearance when walking faster (orange dots). C: reduced loss of second toe lift in PD + LD subjects walking at their natural pace.
Fig. 5.
Fig. 5.
Comparison of phase-plane trajectories of normal (A) and PD subject, S5, off- (B) and on-LD (C). The colors of the traces represent different walking velocities, with red representing the highest velocity and purple representing the lowest velocity. A: normal subjects had a close to circular trajectory during the swing phase, and the peak velocity and step size increased with increases in walking velocity. B: PD subject off-LD had an eccentric phase-plane trajectory, in which the increase in peak velocity with walking velocity was higher relative to step size than that in the normal subjects. C: LD partially normalized the relative shape of the trajectory.
Fig. 6.
Fig. 6.
Main sequence relationship of peak forward velocity and range of Toe-X translation during the swing phases. A: the blue solid line represents the regression line for PD subjects and the black-dotted line represents the regression for normal subjects. B: the red solid line represents the regression line for PD + LD subjects and the black-dotted line represents the regression line for normal subjects. For both A and B, the horizontal and vertical lines are the SDs for the range in toe translation and velocity, respectively. C: variance of X-translation for the normal (black), PD (blue), and PD + LD (red) subjects.
Fig. 7.
Fig. 7.
Model of forward foot movement as a function of walking and frequency. See text for description.
Fig. 8.
Fig. 8.
Forward toe acceleration as a function of toe position during the swing phases. The blue traces represent data from PD subjects and the red traces represent data from PD + LD subjects. The dotted lines are linear regressions of the PD and PD + LD subjects. The black traces represent the average Toe-X acceleration during the swing phase in normal subjects. A and C: data from PD subjects at 0.6 m/s (A) and 1.2 m/s (C). B and D: data from PD + LD subjects at 0.6 m/s (B) and 1.2 m/s (D).
Fig. 9.
Fig. 9.
Slopes of the Toe-X acceleration (ω) vs. toe position of PD subjects as a function of treadmill velocities of 0.6 m/s (A, B) and 1.2 m/s (C, D), off (A, C, blue) and on (B, D, red) LD. The black-dotted lines are linear regressions of the relationship of normal subjects. The heavy blue and red lines are linear regressions of data from PD and PD + LD subjects, respectively. The open circles are data from individual gait cycles. The different colors represent the different walking velocities, with purple being the lowest and red being the highest walking velocities (see color bar to the right). The data on the accelerations from Fig. 8 and the slopes of the toe acceleration as a function of toe position determine the feedback control parameter for the model shown in Fig. 7 during the swing phase.

References

    1. Arias P, Cudeiro J. Effects of rhythmic sensory stimulation (auditory, visual) on gait in Parkinson's disease patients. Exp Brain Res 186: 589–601, 2008 - PubMed
    1. Bello O, Sanchez JA, Fernandez-del-Olmo M. Treadmill walking in Parkinson's disease patients: adaptation and generalization effect. Mov Disord 23: 1243–1249, 2008 - PubMed
    1. Blin O, Ferrandez AM, Pailhous J, Serratrice G. Dopa-sensitive and dopa-resistant gait parameters in Parkinson's disease. J Neurol Sci 103: 51–54, 1991 - PubMed
    1. Blin O, Ferrandez AM, Serratrice G. Quantitative analysis of gait in Parkinson patients: increased variability of stride length. J Neurol Sci 98: 91–97, 1990 - PubMed
    1. Boonstra TA, van der Kooij H, Munneke M, Bloem BR. Gait disorders and balance disturbances in Parkinson's disease: clinical update and pathophysiology. Curr Opin Neurol 21: 461–471, 2008 - PubMed

Publication types

MeSH terms