. 2010 Mar;103(3):1226-37.
doi: 10.1152/jn.00070.2009. Epub 2009 Dec 30.

Mode-locked spike trains in responses of ventral cochlear nucleus chopper and onset neurons to periodic stimuli

Affiliations

Mode-locked spike trains in responses of ventral cochlear nucleus chopper and onset neurons to periodic stimuli

Jonathan Laudanski et al. J Neurophysiol. 2010 Mar.

Abstract

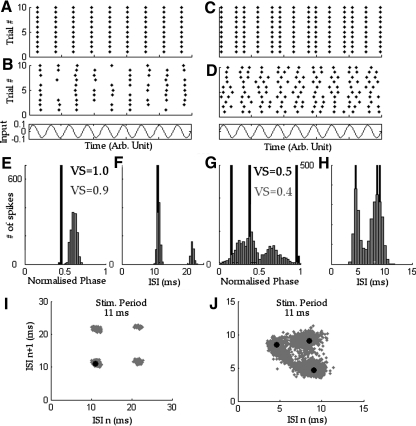
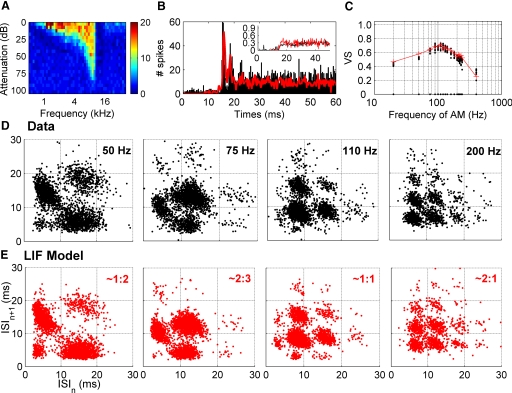
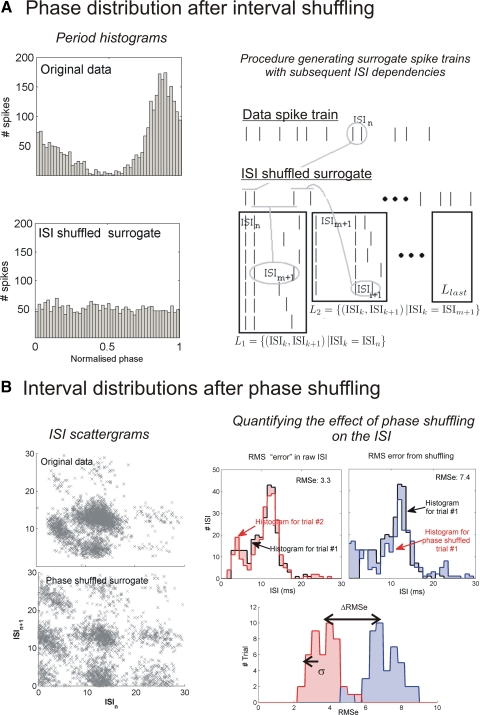
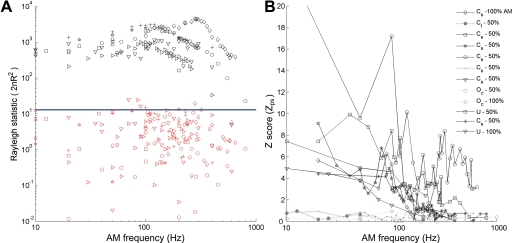
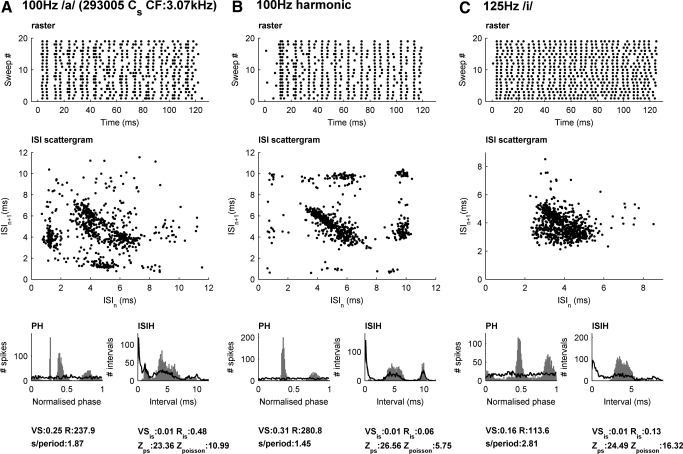
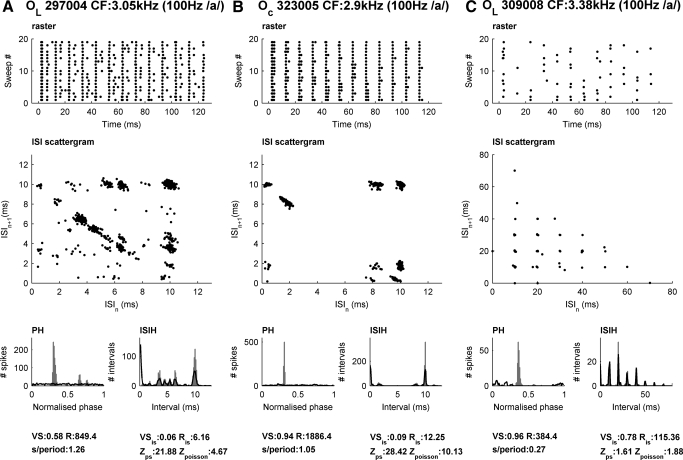
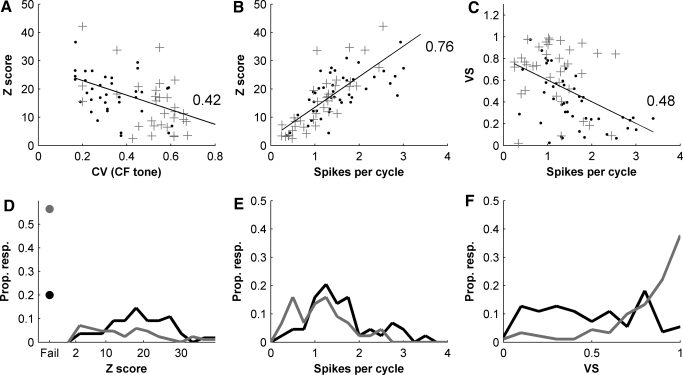
We report evidence of mode-locking to the envelope of a periodic stimulus in chopper units of the ventral cochlear nucleus (VCN). Mode-locking is a generalized description of how responses in periodically forced nonlinear systems can be closely linked to the input envelope, while showing temporal patterns of higher order than seen during pure phase-locking. Re-analyzing a previously unpublished dataset in response to amplitude modulated tones, we find that of 55% of cells (6/11) demonstrated stochastic mode-locking in response to sinusoidally amplitude modulated (SAM) pure tones at 50% modulation depth. At 100% modulation depth SAM, most units (3/4) showed mode-locking. We use interspike interval (ISI) scattergrams to unravel the temporal structure present in chopper mode-locked responses. These responses compared well to a leaky integrate-and-fire model (LIF) model of chopper units. Thus the timing of spikes in chopper unit responses to periodic stimuli can be understood in terms of the complex dynamics of periodically forced nonlinear systems. A larger set of onset (33) and chopper units (24) of the VCN also shows mode-locked responses to steady-state vowels and cosine-phase harmonic complexes. However, while 80% of chopper responses to complex stimuli meet our criterion for the presence of mode-locking, only 40% of onset cells show similar complex-modes of spike patterns. We found a correlation between a unit's regularity and its tendency to display mode-locked spike trains as well as a correlation in the number of spikes per cycle and the presence of complex-modes of spike patterns. These spiking patterns are sensitive to the envelope as well as the fundamental frequency of complex sounds, suggesting that complex cell dynamics may play a role in encoding periodic stimuli and envelopes in the VCN.


Figures

Fig. 1.
Fig. 1.
Examples of different patterns of spike timing in response to a periodic signal, demonstrated using a leaky integrate-and-fire (LIF) model with a sinusoidally modulated input. From top to bottom: A, precise phase-locked pattern of discharge [LIF parameters: τ = 7 ms, Vo = −65 mV, VThres = −50 mV, VReset = −70 mV, I(t) = 11.9*cos(2π*90*Hz*t) mV/ms]. B: the influence of additive Gaussian noise added to the input (D = 0.025 V/√s). The noise creates the random skipping behavior and widens the period histogram. C: an example of a 2:3 mode-locked pattern [LIF parameters: τ = 7 ms, Vo = −65mV, VThres = −50 mV, VReset = −70 mV, I(t) = 2.1 + 3.9*cos(2π*90*t) mV/ms]. The sequence of discharges is defined by a set of 3 phases and gives a low VS (0.51). D: adding Gaussian noise (D = 0.025 V/√s) to the previous LIF model broadens the distribution of phases decreasing the VS. E and F: period histogram and interspike interval (ISI) distribution of the 1:1 mode (black) and the stochastic 1:1 (gray). G and H: period histogram and ISI distribution of the 2:3 mode (black) and the stochastic 2:3 (gray). I and J: ISI scattergram representation of the modes. Black dots represent the sequence of intervals for the deterministic modes.
Fig. 2.
Fig. 2.
Example unit 808009. A: frequency response area. B: peristimulus time histograph (PSTH) of the unit (black) in response to a pure tone at CF 50 dB above threshold. The PSTH of the fitted LIF is superimposed in red. Inset: coefficient of variation increases but remains <0.3 (black: data, red: LIF model). C: synchronization index for all the frequencies tested. D: different examples of ISI scattergrams for 4 of 17 modulation frequencies presented. The ISI scattergrams have a structure similar to the one displayed for the fitted LIF model (E). For an AM of 50 Hz, the discharge rate per modulation cycle is 1.74, and the ISI scattergram pattern resembles the theoretical pattern with 2 points at coordinates (15 ms, 5 ms) and (5 ms, 15 ms). The underlying deterministic modes are given for each AM frequency.
Fig. 3.
Fig. 3.
Criteria for mode-locking using surrogate spike trains. A: phase distribution after interval shuffling. Period histogram (top) for spike trains from unit 808009 obtained from 10 repetitions of a 3-s-long AM tone (75 Hz, 20 dB above threshold) and after (bottom) the interval shuffling of a surrogate spike train obtained from a shuffling scheme keeping subsequent ISI dependencies. The phase preference observed in the original period-histogram is destroyed by the procedure. Right: the explanatory schema of the procedure used to maintain subsequent ISI dependencies. The procedure relies on finding pairs of ISI with similar 1st ISI, and re-ordering these pairs (see methods for more details.) B: ISI scattergram of the same unit before (top) and after (bottom) phase shuffling of the spike trains. The original ISI scattergram structure is destroyed. Right-most panel: how a z score is generated that measures how much ISI structure is lost by phase shuffling.
Fig. 4.
Fig. 4.
A: Rayleigh statistics for all 11 units recorded for AM pure tone stimulation (black symbols) and for their surrogate spike trains (red symbols) obtained from 1st shuffling scheme. For all cells, most surrogate conditions are below the significance level (blue line, Ris = 13.8). Hence, the locked structure is not a result of the ISI dependencies. B: z score index (Zps) for the phase shuffled surrogate (scheme 2, see methods). This index shows that the root mean squared error (RMSe) between data and phase-shuffled surrogate is >2 SD of intertrial variability for 5 of 7 choppers. Hence for all but 2 chopper units and 2 onset units, maintaining the phase preference isn't enough to explain the ISI structure. The symbol given for each unit is shown in the legend and is similar in A and B.
Fig. 5.
Fig. 5.
An example of a sustained chopper unit [3-kHz characteristic frequency (CF)] that shows complex modes of firing in response to vowels and harmonic complexes. A: the response to a steady-state 100-Hz vowel /a/. B: The response to a 100-Hz cosine-phase harmonic complex. C: the response to a 125-Hz vowel /e/. Top: a raster plot of spike times for 20 different presentations of the stimulus. Second row: ISI scattergrams. Third row: period histograms and 1st-order interval spike histograms for each stimulus. The histograms for the interval-shuffling (on the PH) and the period shuffling (on the ISIH) are superimposed in black. Bottom: measures of the firing behavior for the data and for the shuffled data. An Ris score of <13.8 (Rayleigh criterion) and a z score of ≥2 is required to meet our criterion for “mode-locking.”
Fig. 6.
Fig. 6.
The responses of 3 different onset units (all with a CF ∼ 3 kHz) to a 100-Hz vowel /a/. The representation is the same as for Fig. 4. A: onset-C unit showing “complex-modes of firing” (i.e., meeting our criteria for mode-locking). B: an onset-C unit that shows almost perfect entrainment (1:1 mode-locking). C: an onset-L unit that behaves like a Poisson process.
Fig. 7.
Fig. 7.
Population measures of the responses to complex periodic stimuli in chopper (blue points) and onset (red crosses) units. Blue lines and points indicate chopper unit responses. Red lines and crosses indicate onset unit response. Numbers within axes give correlation coefficients (see text for statistical significance). A: regularity of a pure tone at CF, 50 dB above unit threshold (calculated from 30 to 50 ms after tone onset) vs. Z score for units passing mode-locking criteria (ML units). B: z score vs. number of spikes per cycle for ML units. C: vector strength (VS) vs. spike per cycle for ML units. D: distribution of z scores across units. Non-ML units are shown as points at “fail.” E: distribution of spikes per cycle across ML units. F: distribution of VS across all units irrespective of ML criteria.

Similar articles

Cited by

References

    1. Aihara K, Matsumoto G, Ikegaya Y. Periodic and non-periodic responses of a periodically forced Hodgkin-Huxley oscillator. J Theo Biol 109: 249–269, 1984 - PubMed
    1. Arle JE, Kim DO. Neural modeling of intrinsic and spike-discharge properties of cochlear nucleus neurons. Biol Cybern 64: 273–283, 1991 - PubMed
    1. Bal R, Oertel D. Potassium currents in octopus cells of the mammalian cochlear nucleus. J Neurophysiol 86: 2299–2311, 2001 - PubMed
    1. Banks MI, Sachs MB. Regularity analysis in a compartmental model of chopper units in the anteroventral cochlear nucleus. J Neurophysiol 65: 606–629, 1991 - PubMed
    1. Blackburn CC, Sachs MB. Classification of unit types in the anteroventral cochlear nucleus: PST histograms and regularity analysis. J Neurophysiol 62: 1303–1329, 1989 - PubMed

Publication types

LinkOut - more resources