. 2010 May 20;115(20):4043-50.
doi: 10.1182/blood-2009-09-241638. Epub 2009 Dec 30.

Akt1 and Akt2 promote peripheral B-cell maturation and survival

Affiliations

Akt1 and Akt2 promote peripheral B-cell maturation and survival

Marco Calamito et al. Blood. .

Abstract

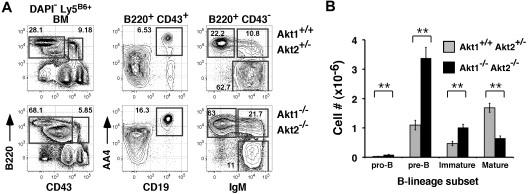
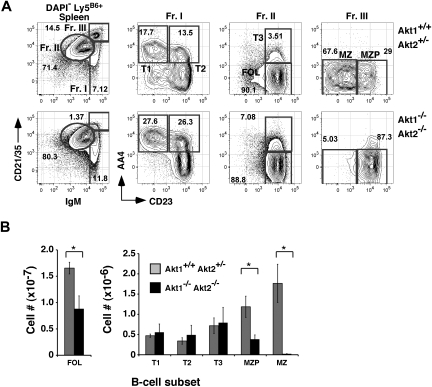
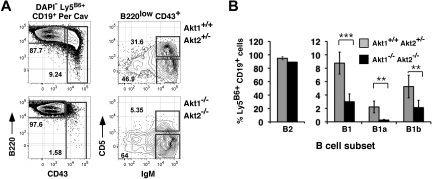
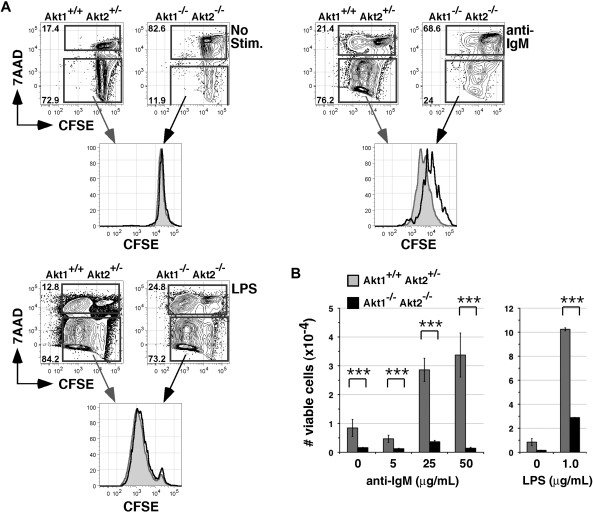
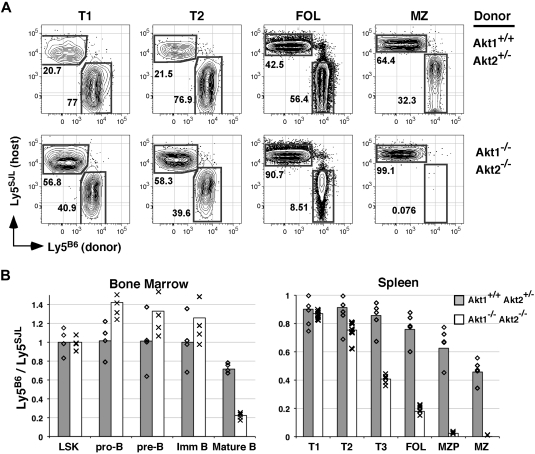
Although the 3 isoforms of Akt regulate cell growth, proliferation, and survival in a wide variety of cell types, their role in B-cell development is unknown. We assessed B-cell maturation in the bone marrow (BM) and periphery in chimeras established with fetal liver progenitors lacking Akt1 and/or Akt2. We found that the generation of marginal zone (MZ) and B1 B cells, 2 key sources of antibacterial antibodies, was highly dependent on the combined expression of Akt1 and Akt2. In contrast, Akt1/2 deficiency did not negatively affect the generation of transitional or mature follicular B cells in the periphery or their precursors in the BM. However, Akt1/2-deficient follicular B cells exhibited a profound survival defect when forced to compete against wild-type B cells in vivo. Altogether, these studies show that Akt signaling plays a key role in peripheral B-cell maturation and survival.


Figures

Figure 1
Figure 1
Akt-deficient progenitors generate marrow B-lineage precursors. (A) Representative flow cytometric analysis of BM cells from chimeras established with Akt1+/+Akt2+/− (top) or Akt1−/−Akt2−/− (bottom) progenitors 12 to 14 weeks previously. The left-most plots are gated on viable donor-derived (DAPI Ly5B6+) cells. Numbers in plots indicate the frequency of events in the indicated gate as a function of the indicated parent population. Pro-B, CD43+ B220+ CD19+ AA4+; pre-B, CD43low B220+ IgM AA4+; immature B, CD43 B220+ IgM+ AA4+; mature B, CD43 B220+ IgM+ AA4. (B) Absolute cell numbers for respective BM populations were calculated using the gates shown in panel A. Error bars indicate the SEM for each group; n = 5. Data are representative of 2 separate experiments. *P ≤ .01.
Figure 2
Figure 2
MZ B-cell development is highly dependent on Akt1/2. (A) Representative analysis of splenocytes from chimeras established with Akt1+/+Akt2+/− (top) or Akt1−/−Akt2−/− (bottom) progenitors 12 to 14 weeks previously. Viable donor-derived cells were gated as in Figure 1. Numbers in plots show the frequency of events as a function of the indicated parent gate. (B) Absolute cell numbers for respective splenic B-cell subsets were calculated using the gates shown in panel A. Error bars indicate the SEM for each group; n = 5. Data are representative of 2 separate experiments. *P ≤ .05.
Figure 3
Figure 3
Requirement for Akt1/2 for B1 B-cell development. (A) Representative analysis of peritoneal cavity lymphocytes from chimeras established with Akt1+/+Akt2+/− (top) or Akt1−/−Akt2−/− (bottom) progenitors 12 to 14 weeks previously. The leftmost plots are gated on viable donor-derived B cells (DAPI Ly5B6+ CD19+). Numbers in plots show the frequency of events as a function of the indicated parent gate. (B) Average frequencies for the indicated subsets were calculated using the gates shown in panel A. B2, CD19+ B220+ CD43; B1, CD19+ B220+ CD43+; B1a, CD19+ B220+ CD43+ CD5+; B1b, CD19+ B220+ CD43+ CD5. Error bars indicate the SEM for each group; n = 5. Data are representative of 2 separate experiments. **P ≤ .01; ***P ≤ .005.
Figure 4
Figure 4
Akt1/2-deficient B cells exhibit a defective BCR-mediated proliferative response. (A) CFSE-labeled CD23+ follicular B cells were left unstimulated (top plots) or stimulated with 50 mg/mL anti-IgM antibodies (middle) or 1 μg/mL LPS (bottom) for 3 days, stained with the viability dye 7AAD, and analyzed by flow cytometry. The right-most overlay histograms were gated on viable (7AAD) cells using the gates indicated in the corresponding plots. Black line indicates Akt1−/−Akt2−/−; gray filled curves, Akt1+/+Akt2+/−. (B) Mean numbers of viable Akt1−/−Akt2−/− or Akt1+/+Akt2+/− B cells recovered from triplicate cultures stimulated with the indicated concentrations of anti-IgM antibodies or LPS were calculated by flow cytometry using the 7AAD gates shown in panel A. Error bars indicate SEMs from 4 animals per group. Data are representative of 2 separate experiments. ***P ≤ .005.
Figure 5
Figure 5
Akt1/2-deficient B cells compete poorly with wild-type B cells. (A) Double chimeras were analyzed at 16 weeks after transplantation. (A) Representation of the indicated B-cell subset derived from WT (Ly5SJL+) or Akt1+/+Akt2+/− (top) or Akt1−/−Akt2−/− (bottom) progenitors. Each subset was gated as shown in Figure 2. (B) The average ratio of cells in the indicated subpopulation derived from Ly5B6+ and Ly5SJL+ progenitors in double chimeras established with Akt1+/+Akt2+/− or Akt1−/−Akt2−/− progenitors was calculated using gates shown in Figures 1 and 2 with 4 or 5 animals per group. Individual mice are indicated by ◇ and ×. LSK indicates Lineage c-Kit+ Sca-1+. Data are representative of 2 separate experiments.
Figure 6
Figure 6
Expression of Akt isoforms in B-lineage cells. (A) Relative Akt isoform expression in sorted BM, splenic, and peritoneal B-cell populations measured by qRT-PCR. Data are expressed relative to wild-type follicular B cells. Brain and liver cDNA serve as positive controls for Akt3 and Akt2 mRNA, respectively. (B) Δ-Ct values for Akt1, Akt2, and Akt3 relative to endogenous control 18s, within each of the indicated B-cell populations as in panel A. (C) Akt3 transcript abundance in sorted B-cell populations from Akt1/2 DKO chimeras relative to the corresponding wild-type population. Error bars represent relative quantity maximum and minimum for each sample (A,C) or SD of Δ-Ct for each sample (B).

Similar articles

Cited by

References

    1. Rolink A, Haasner D, Melchers F, Andersson J. The surrogate light chain in mouse B-cell development. Int Rev Immunol. 1996;13(4):341–356. - PubMed
    1. Melchers F, ten Boekel E, Seidl T, et al. Repertoire selection by pre-B-cell receptors and B-cell receptors, and genetic control of B-cell development from immature to mature B cells. Immunol Rev. 2000;175:33–46. - PubMed
    1. Allman DM, Ferguson SE, Lentz VM, Cancro MP. Peripheral B cell maturation: II, heat-stable antigen(hi) splenic B cells are an immature developmental intermediate in the production of long-lived marrow-derived B cells. J Immunol. 1993;151(9):4431–4444. - PubMed
    1. Allman D, Pillai S. Peripheral B cell subsets. Curr Opin Immunol. 2008;20(2):149–157. - PMC - PubMed
    1. Allman D, Srivastava B, Lindsley RC. Alternative routes to maturity: branch points and pathways for generating follicular and marginal zone B cells. Immunol Rev. 2004;197:147–160. - PubMed

Publication types