. 2010 Mar;298(3):C602-10.
doi: 10.1152/ajpcell.00422.2009. Epub 2009 Dec 30.

Acetylsalicylic acid enhances purinergic receptor-mediated outward currents in rat megakaryocytes

Affiliations

Acetylsalicylic acid enhances purinergic receptor-mediated outward currents in rat megakaryocytes

José P Young et al. Am J Physiol Cell Physiol. 2010 Mar.

Abstract

Purinergic receptor activation increases cytosolic Ca(2+) concentration in a fluctuating fashion, triggering oscillatory outward Ca(2+)-activated K(+) currents in rat megakaryocytes (MKs). Whole cell and nystatin-perforated patch-clamp techniques were used to analyze changes in ionic conductance in MK with acetylsalicylic acid (ASA), a cyclooxygenase-1 inhibitor and antithrombotic agent. MKs are a model for platelet reactivity, particularly in ASA treatment failure (ASA resistance). Freshly isolated MKs were incubated 30 min in the absence or presence of 1 mM ASA. Using a K(+)-rich internal solution, we recorded outward currents in response to 10 microM ATP, 10 microM ADP, and 5 microM 2-methyl-thio-ADP (2MeSADP) in the voltage-clamp mode. Agonist-induced currents decreased in amplitude over time, but this decline was attenuated by ASA in both continuous and repeated agonist challenge, indicating increased MK reactivity with ASA treatment. In separate experiments, heterologous desensitization was observed when MKs were stimulated with ADP after exposure to a thromboxane receptor agonist (U46619), indicating cross talk between thromboxane and purinergic pathways. Different cells, treated with ASA or MRS2179 (P2Y1 receptor antagonist), were stimulated with 2MeSADP. The dose-response curve was shifted to the left in both cases, suggesting increased MK reactivity. ASA also caused an increased interval between currents (delay). ASA attenuated desensitization of purinergic receptors and increased delay, again suggesting cross talk between purinergic and thromboxane pathways. These findings may be relevant to ASA resistance, because individual variations in sensitivity to the multiple effects of ASA on signaling pathways could result in insensitivity to its antiplatelet effects in some patients.


Figures

Fig. 1.
Fig. 1.
Sample megakaryocytes (MKs) studied on the basis of morphology. Brightfield photomicrographs (×40). A: stage I MK illustrating a viable cell on the left and a darker nonviable cell on the right (Trypan blue exclusion viability test). Phase contrast photomicrographs (×60). B: stage II MK with protruding pseudopodia. C: stage III MK ruffling and blebbing. Cells were in extracellular recording solution (ES) at room temperature. Calibration bars represent 10 μm.
Fig. 2.
Fig. 2.
Representative traces illustrating variable responses of distinct MKs to ATP recorded with nystatin-perforated patch clamp. Traces shown are from 3 different experiments in which 10 μM ATP was applied during the time indicated by the horizontal bar at the top. The internal solution contained (in mM) 150 KCl, 10 HEPES, pH 7.2–7.3; holding potential (VH) = −40 mV. A: ATP-induced oscillatory outward currents displaying gradual decrease in amplitude (desensitization). B: single current response in another MK. C: lack of response in a third example cell.
Fig. 3.
Fig. 3.
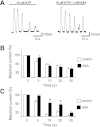
Progressive decay of outward current amplitude during the first 30 s of purinergic agonist exposure. A: representative conventional patch-clamp recordings of oscillation in MKs showing desensitization during continuous 10 μM ATP exposure in control cells (left) and cells exposed to 1 mM acetylsalicylic acid (ASA; right). B and C: effects of ASA on the progressive decay of outward current amplitude at distinct time points during the first 30 s of continuous application of ADP (B) and ATP (C). Each value represents the percent change of normalized current amplitude, setting the first peak amplitude as 100%. Values are means ± SE for 10 μM. ADP: control n ≥ 8, ASA n ≥ 9; 10 μM. ATP: control n = 9, ASA n = 8. *P ≤ 0.05.
Fig. 4.
Fig. 4.
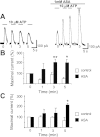
ASA reverses time-dependent degradation of purinergic receptor agonist-induced outward current in MKs. A: example of conventional whole cell patch-clamp recordings (VH = −40 mV) of 10 μM ATP-induced outward current comparing the action of 1 mM ASA (right) to control (left) on the first oscillatory response to that of subsequent application at distinct time intervals in minutes as indicated below each trace. B: ADP summary data. Each value represents current amplitude observed with each repeated application at subsequent times (1, 3, 5 min) normalized to that of the initial application of 10 μM ADP. Values are means ± SE for control n = 9 and ASA-treated n = 15 MKs. **P ≤ 0.01 at 3 min. *P < 0.05 at 5 min. C: ATP summary data. Results obtained with a similar protocol as in B. Values are means ± SE for control n = 8; ASA-treated n = 9 MKs. *P < 0.05 at 5 min.
Fig. 5.
Fig. 5.
ASA and indomethacin treatment prevents decline of outward current amplitude in MKs induced by a P2Y receptor selective agonist. A: example of recordings of 5 μM 2-methyl-thio-ADP (2MeSADP)-induced outward current comparing in distinct MKs the action of 1 mM ASA (right) to control (left) on the first peak of the oscillatory response obtained with the 0-, 1-, 3-, 5-min protocol. B: 2MeSADP summary data. Each value represents the current amplitude observed with each repeated application of 5 μM 2MeSADP at subsequent times (1, 3, 5 min) normalized to that of the initial application. Values are means ± SE for control n = 15, ASA 1 μM-treated n = 7, and indomethacin 10 μM-treated n = 9 MKs. *P < 0.01 compared with control.
Fig. 6.
Fig. 6.
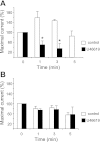
A thromboxane agonist enhances desensitization of ADP-activated current in MKs. Purinergic-induced outward current amplitude decays after 30-s exposure to U46619 measured by patch-clamp recordings (VH = −40 mV). Values represent the current amplitude observed with the 0-, 1-, 3-, 5-min protocol normalized to that of the initial application of the P2 receptor agonist. A: 10 μM ADP summary response after exposure to 2 μM U46619, demonstrating heterologous desensitization of the P2Y and thromboxane receptor (TP) receptor pathways. Values are means ± SE for control n = 7 and U46619 2 μM-treated n = 19 MKs. *P ≤ 0.05. B: 10 μM ATP summary response after the exposure to 2 μM U46619. The lack of significant changes of the response after exposure to 2 μM U46619 indicates that the P2X pathway is not affected by TP receptor stimulation. Values are means ± SE for control n = 7 and U46619 2 μM-treated n = 5 MKs. P = not significant.
Fig. 7.
Fig. 7.
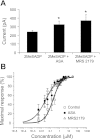
ASA increases maximal response and shifts to the left the dose response to the P2Y receptor agonist 2MeSADP. Summary of outward current recorded with nystatin-perforated patch clamp in MKs upon application of increasing doses of 2MeSADP. A: maximal currents observed in response to 5 μM 2MeSADP. Values are means ± SE for control n ≥ 10, 1 mM ASA-treated n ≥ 6, and 10 μM MRS2179-treated n ≥ 9 MKs; *P = 0.05. B: dose-response curves with current values normalized to the highest outward current amplitude. Values are means ± SE. □, Values for control n ≥ 10 cells in ES (EC50 = 0.20 μM). ●, Values for n ≥ 6 MKs incubated in 1 mM ASA for at least 30 min (EC50 = 0.033 μM). ▵, Values for n ≥ 9 cells stimulated with 2MeSADP in the presence of 10 μM MRS2179 (EC50 = 0.029 μM).
Fig. 8.
Fig. 8.
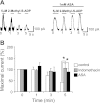
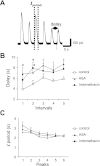
Changes in delay and duration of the peak (Iperiod) during the first 30 s 5 μM 2MeSADP exposure. A: example current traces recorded with the nystatin-perforated patch-clamp configuration from a control cell stimulated with 5 μM 2MeSADP. Dashed lines indicate the Iperiod (duration of the outward current), and the double-arrowed segment defines the “delay” as the time from 1 peak to the next. B: summary data illustrating values for delay in control cells compared with MKs incubated for 30 min in 1 mM ASA or exposed to 10 μM indomethacin. Values are means ± SE for control n ≥ 14, ASA n ≥ 17 cells, and indomethacin n = 9 cells. *P ≤ 0.05. C: summary of values for Iperiod in control cells and in cells incubated with 1 mM ASA for 30 min. Values are means ± SE for control n ≥ 10, ASA n ≥ 9, and indomethacin n ≥ 5. P = not significant.

Similar articles

Cited by

References

    1. A randomised, blinded, trial of clopidogrel versus aspirin in patients at risk of ischaemic events (CAPRIE) CAPRIE Steering Committee. Lancet 348: 1329–1339, 1996 - PubMed
    1. Authi KS. TRP channels in platelet function. Handb Exp Pharmacol 179: 425–443, 2007 - PubMed
    1. Barton JF, Hardy AR, Poole AW, Mundell SJ. Reciprocal regulation of platelet responses to P2Y and thromboxane receptor activation. J Thromb Haemost 6: 534–543, 2008 - PubMed
    1. Baurand A, Eckly A, Hechler A, Kauffenstein G, Galzi JL, Cazenave JP, Léon C, Gachet C. Differential regulation and relocalization of the platelet P2Y receptors after activation: a way to avoid loss of hemostatic properties? Mol Pharmacol 67: 721–733, 2005 - PubMed
    1. Bergmeier W, Stefanini L. Novel molecules in calcium signaling in platelets. J Thromb Haemost 7, Suppl 1: 187–190, 2009 - PubMed

Publication types

MeSH terms