

Household transmission of 2009 pandemic influenza A (H1N1) virus in the United States
- PMID: 20042753
- PMCID: PMC3840270
- DOI: 10.1056/NEJMoa0905498
Household transmission of 2009 pandemic influenza A (H1N1) virus in the United States
Abstract
Background: As of June 11, 2009, a total of 17,855 probable or confirmed cases of 2009 pandemic influenza A (H1N1) had been reported in the United States. Risk factors for transmission remain largely uncharacterized. We characterize the risk factors and describe the transmission of the virus within households.
Methods: Probable and confirmed cases of infection with the 2009 H1N1 virus in the United States were reported to the Centers for Disease Control and Prevention with the use of a standardized case form. We investigated transmission of infection in 216 households--including 216 index patients and their 600 household contacts--in which the index patient was the first case patient and complete information on symptoms and age was available for all household members.
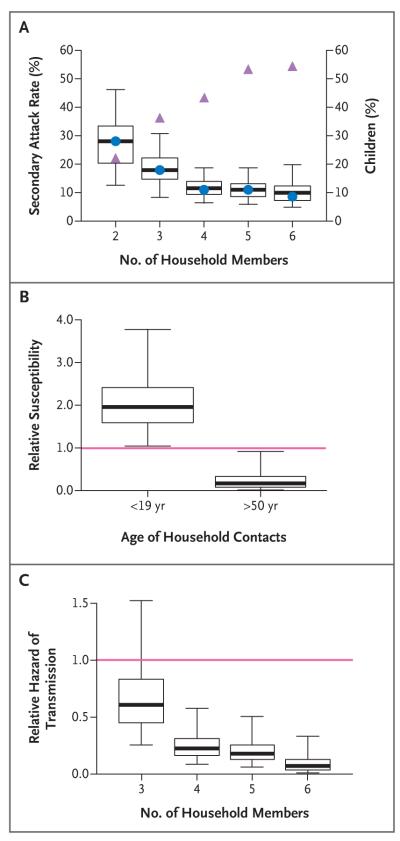
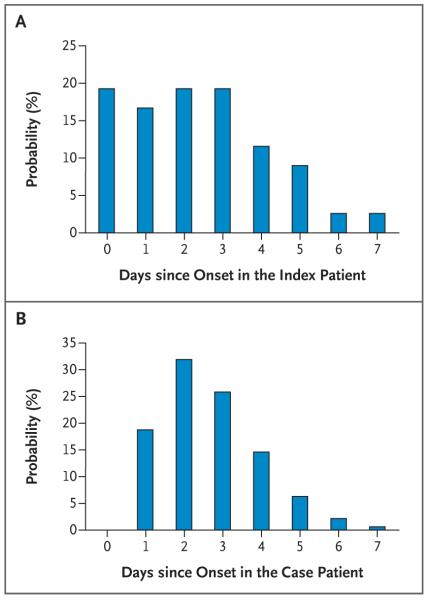
Results: An acute respiratory illness developed in 78 of 600 household contacts (13%). In 156 households (72% of the 216 households), an acute respiratory illness developed in none of the household contacts; in 46 households (21%), illness developed in one contact; and in 14 households (6%), illness developed in more than one contact. The proportion of household contacts in whom acute respiratory illness developed decreased with the size of the household, from 28% in two-member households to 9% in six-member households. Household contacts 18 years of age or younger were twice as susceptible as those 19 to 50 years of age (relative susceptibility, 1.96; Bayesian 95% credible interval, 1.05 to 3.78; P=0.005), and household contacts older than 50 years of age were less susceptible than those who were 19 to 50 years of age (relative susceptibility, 0.17; 95% credible interval, 0.02 to 0.92; P=0.03). Infectivity did not vary with age. The mean time between the onset of symptoms in a case patient and the onset of symptoms in the household contacts infected by that patient was 2.6 days (95% credible interval, 2.2 to 3.5).
Conclusions: The transmissibility of the 2009 H1N1 influenza virus in households is lower than that seen in past pandemics. Most transmissions occur soon before or after the onset of symptoms in a case patient.
2009 Massachusetts Medical Society
Figures
References
-
- 2009 H1N1 flu: situation update. Centers for Disease Control and Prevention; Atlanta: [Accessed December 4, 2009]. http://www.cdc.gov/h1n1flu/update.htm.
-
- Hospitalized patients with novel influenza A (H1N1) virus infection — California, April–May, 2009. MMWR Morb Mortal Wkly Rep. 2009;58:536–41. - PubMed
-
- Novel Swine-Origin Influenza A (H1N1) Virus Investigation Team Emergence of a novel swine-origin influenza A (H1N1) virus in humans. N Engl J Med. 2009;360:2605–15. - PubMed
- N Engl J Med. 2009;361:102. Erratum.
-
- CDC recommendations for the amount of time persons with influenza-like illness should be away from others. Centers for Disease Control and Prevention; Atlanta: [Accessed December 4, 2009]. http://www.cdc.gov/H1N1flu/guidance/exclusion.htm.
-
- H1N1 flu: clinical and public health guidance. Centers for Disease Control and Prevention; Atlanta: [Accessed December 4, 2009]. http://www.cdc.gov/h1n1flu/casedef.htm.
Publication types
MeSH terms
Grants and funding
LinkOut - more resources
Full Text Sources
Medical
Miscellaneous