. 2010 Apr;35(5):1138-54.
doi: 10.1038/npp.2009.219. Epub 2009 Dec 30.

A sensitive period of mice inhibitory system to neonatal GABA enhancement by vigabatrin is brain region dependent

Affiliations

A sensitive period of mice inhibitory system to neonatal GABA enhancement by vigabatrin is brain region dependent

Tamar Levav-Rabkin et al. Neuropsychopharmacology. 2010 Apr.

Abstract

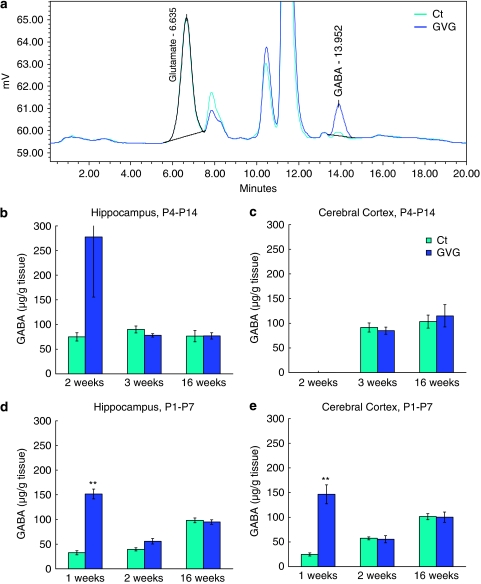
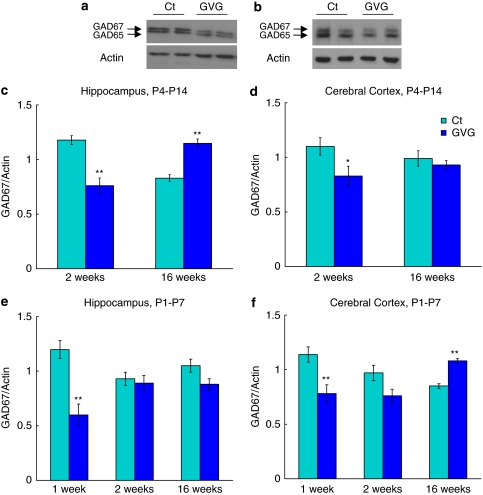
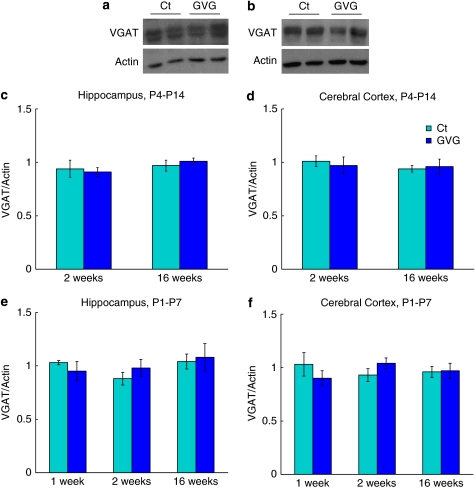
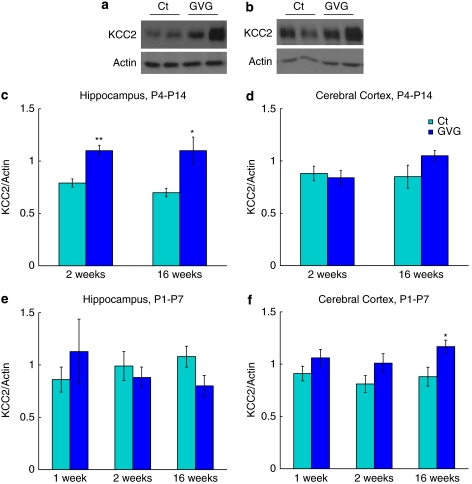
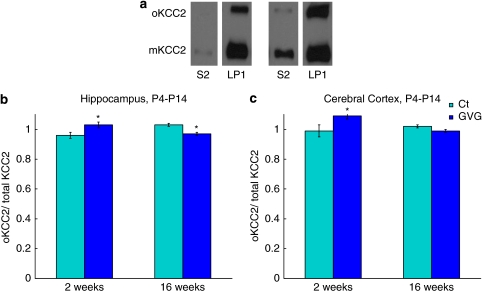
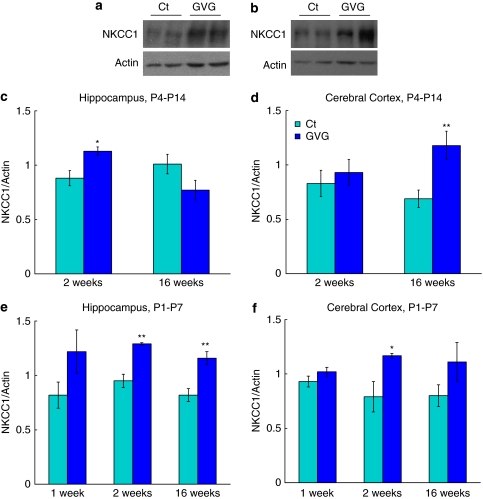
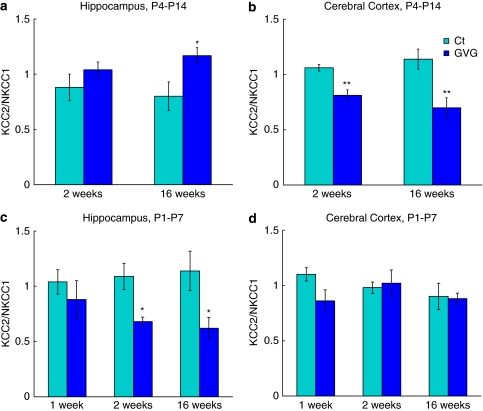
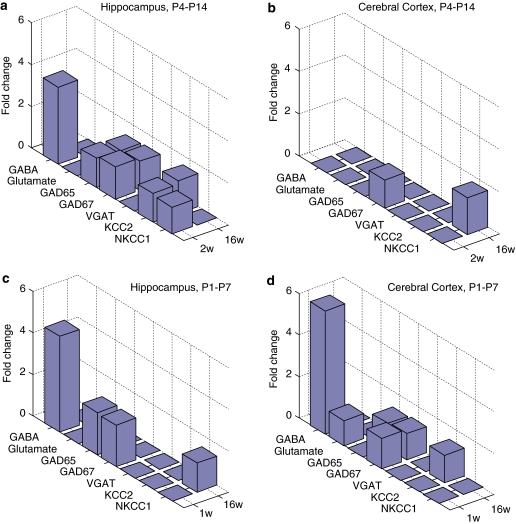
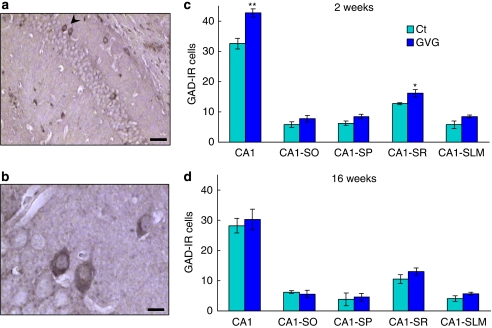
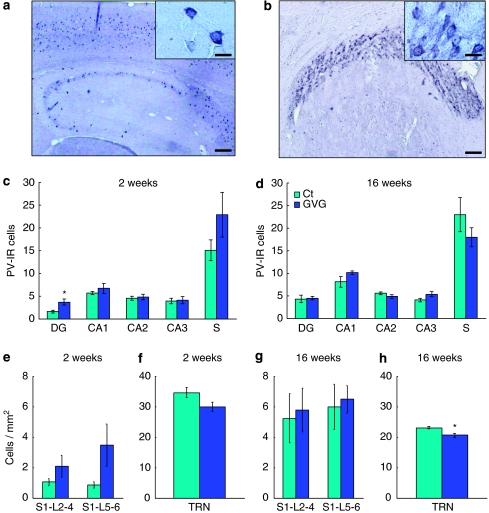
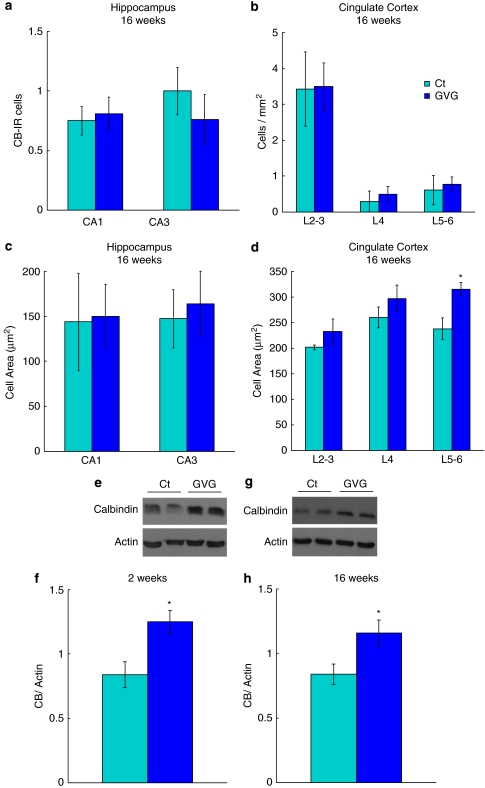
Neurodevelopmental disorders, such as schizophrenia and autism, have been associated with disturbances of the GABAergic system in the brain. We examined immediate and long-lasting influences of exposure to the GABA-potentiating drug vigabatrin (GVG) on the GABAergic system in the hippocampus and cerebral cortex, before and during the developmental switch in GABA function (postnatal days P1-7 and P4-14). GVG induced a transient elevation of GABA levels. A feedback response to GABA enhancement was evident by a short-term decrease in glutamate decarboxylase (GAD) 65 and 67 levels. However, the number of GAD65/67-immunoreactive (IR) cells was greater in 2-week-old GVG-treated mice. A long-term increase in GAD65 and GAD67 levels was dependent on brain region and treatment period. Vesicular GABA transporter was insensitive to GVG. The overall effect of GVG on the Cl(-) co-transporters NKCC1 and KCC2 was an enhancement of their synthesis, which was dependent on the treatment period and brain region studied. In addition, a short-term increase was followed by a long-term decrease in KCC2 oligomerization in the cell membrane of P4-14 hippocampi and cerebral cortices. Analysis of the Ca(2+) binding proteins expressed in subpopulations of GABAergic cells, parvalbumin and calbindin, showed region-specific effects of GVG during P4-14 on parvalbumin-IR cell density. Moreover, calbindin levels were elevated in GVG mice compared to controls during this period. Cumulatively, these results suggest a particular susceptibility of the hippocampus to GVG when exposed during days P4-14. In conclusion, our studies have identified modifications of key components in the inhibitory system during a critical developmental period. These findings provide novel insights into the deleterious consequences observed in children following prenatal and neonatal exposure to GABA-potentiating drugs.


Figures

Figure 1
Figure 1
Transient elevation of GABA levels due to neonatal vigabatrin (GVG) treatment. A representative chromatogram of GABA and glutamate levels in cerebral cortex of 1-week-old mice of Ct1–7 and GVG1–7 groups (a). GABA levels (μg/g tissue) in the hippocampus and cerebral cortex of P4–14 treated mice at 2, 3, and 16 weeks (b, c) and of P1–7 treated mice at 1, 2, and 16 weeks (d, e). n=3–8 at each point for each group; **p<0.01; Student's t-test. Results are presented as mean±SEM.
Figure 2
Figure 2
The effect of vigabatrin (GVG) on GAD67 levels in young and adult mice. Examples of GAD65/67 and actin in homogenates of 2-week-old mice hippocampi (a), and 16-week-old mice cerebral cortices (b) of Ct4–14 and GVG4–14 groups. GAD67 levels normalized to actin at 2 and 16 weeks in P4–14 hippocampus (c) and cerebral cortex (d). GAD67 levels normalized to actin at 1, 2, and 16 weeks in P1–7 hippocampus (e) and cerebral cortex (f). n=4–10 at each point for each group; **p<0.01; *p<0.05. Univariate analysis of variance (ANOVA) and Student's t-test were used for all analyses. Results are presented as mean±SEM. The results of each trial were normalized to the trial mean. Four to five independent repeats of each sample were averaged (each repeat includes a duplicate of each sample).
Figure 3
Figure 3
Neonatal vigabatrin (GVG) exposure did not affect the expression of vesicular GABA transporter (VGAT). Examples of VGAT and actin in homogenates of 2-week-old mice hippocampi (a), and 16-week-old mice cerebral cortices (b) of Ct4–14 and GVG4–14 groups. VGAT levels normalized to actin at 2 and 16 weeks in P4–14 hippocampus (c) and cerebral cortex (d). VGAT levels normalized to actin at 1, 2, and 16 weeks in P1–7 hippocampus (e) and cerebral cortex (f). n=4–11 at each point for each group. Univariate analysis of variance (ANOVA) and Student's t-test were used for all analyses. Results are presented as mean±SEM. The results of each trial were normalized to the trial mean. Four to five independent repeats of each sample were averaged (each repeat includes a duplicate of each sample).
Figure 4
Figure 4
Modulation of the K+-Cl co-transporter KCC2. Examples of KCC2 and actin in homogenates of 2-week-old mice hippocampi (a), and 16-week-old mice cerebral cortices (b) of Ct4–14 and GVG4–14 groups. KCC2 levels normalized to actin at 2 and 16-weeks in P4–14 hippocampus (c) and cerebral cortex (d). KCC2 levels normalized to actin at 1, 2, and 16 weeks in P1–7 hippocampus (e) and cerebral cortex (f). n=4–10 at each point for each group; **p<0.01; *p<0.05. Univariate analysis of variance (ANOVA) and Student's t-test were used for all analyses. Results are presented as mean±SEM. The results of each trial were normalized to the trial mean. Four to five independent repeats of each sample were averaged (each repeat includes a duplicate of each sample).
Figure 5
Figure 5
Effect of neonatal vigabatrin (GVG) treatment on oligomerization of the K+-Cl co-transporter KCC2. Examples of KCC2 monomer (mKCC2) and KCC2 oligomer (oKCC2) in the crude cytoplasmic fraction, S2, and plasma-membrane-enriched fraction, LP1, in Ct mice (a). Oligomer portion of total KCC2 in LP1 fraction at 2 and 16 weeks in P4–14 hippocampus (b) and cerebral cortex (c). n=7–9; *p<0.05. Univariate analysis of variance (ANOVA) and Student's t-test were used for all analyses. Results are presented as mean±SEM. The results of each trial were normalized to the trial mean. Two to three independent repeats of each sample were averaged (each repeat includes a duplicate of each sample).
Figure 6
Figure 6
Effect of vigabatrin (GVG) on the Na+-K+-2Cl co-transporter. Examples of NKCC1 and actin in homogenates of 2-week-old mice hippocampi (a), and 16-week-old mice cerebral cortices (b) of Ct4–14 and GVG4–14 groups. NKCC1 levels normalized to actin at 2 and 16 weeks in P4–14 hippocampus (c) and cerebral cortex (d). NKCC1 levels normalized to actin at 1, 2, and 16 weeks in P1–7 hippocampus (e) and cerebral cortex (f). n=3–9 at each point for each group; **p<0.01; *p<0.05. Univariate analysis of variance (ANOVA) and Student's t-test were used for all analyses. Results are presented as mean±SEM. The results of each trial were normalized to the trial mean. Four to five independent repeats of each sample were averaged (each repeat includes a duplicate of each sample).
Figure 7
Figure 7
The ratio between KCC2 and NKCC1 in the crude cytoplasmic fraction. KCC2/NKCC1 ratio at 2 and 16 weeks in P4–14 hippocampus (a) and cerebral cortex (b), and at 1, 2, and 16 weeks in P1–7 hippocampus (c) and cerebral cortex (d). n=4–9 at each point for each group; **p<0.01; *p<0.05. Univariate analysis of variance (ANOVA) and Student's t-test were used for all analyses. Results are presented as mean±SEM. The results of each trial were normalized to the trial mean. Four to five independent repeats of each sample were averaged (each repeat includes a duplicate of each sample).
Figure 8
Figure 8
Summary of vigabatrin (GVG) effects on components of the GABAergic system. Short- and long-term influence of neonatal GVG exposure on components of the inhibitory system represented in fold-change, at 2 and 16weeks in P4–14 hippocampus (a) and cerebral cortex (b), and 1 and 16 weeks in P1–7 hippocampus (c) and cerebral cortex (d).
Figure 9
Figure 9
The effect of vigabatrin (GVG) on GAD65/67-immunoreactive (IR) cell density in the hippocampus. An example of GAD65/67-IR cells (arrowhead) in the CA1 field of adult mice hippocampi (a, b). The number of GAD65/67-IR cells was evaluated in the CA1 field of the hippocampus and in sublayers of CA1 in mice at 2 weeks (c) and at 16 weeks (d). CA1-SO, stratum oriens; CA1-SP, stratum pyramidale; CA1-SR, stratum radiatum; CA1-SLM, stratum lacunosum moleculare. n=3–6 mice, 2–5 sections, at each point for each group; **p<0.01; *p<0.05. Repeated-measures analysis of variance (ANOVA) and Student's t-test were used for all analyses. Results are presented as mean±SEM. Calibration bar represents 50 μm (a) and 10 μm (b).
Figure 10
Figure 10
Region-specific alterations in parvalbumin-immunoreactive (IR) cells due to P4–14 vigabatrin (GVG) treatment. Examples of PV-IR cells in adult hippocampus and cortex (a), CA1 field (a, inset), and thalamic reticular nucleus (TRN, b). The number of PV-IR cells was evaluated in the dentate gyrus (DG), CA1–3 fields of the hippocampus and the subiculum (S) in 2- and 16-week-old mice (c, d). Cell density of PV-IR cells was examined in layers of the primary sensory cortex (S1, L2–6) and the TRN at 2 and 16 weeks (e–h). n=4–6 mice; 2–5 sections, at each point for each group; *p<0.05. Repeated-measures analysis of variance (ANOVA) and Student's t-test were used for all analyses. Results are presented as mean±SEM. Calibration bar represents 150 μm (a, b), 20 μm (a, inset), and 30 μm (b, inset).
Figure 11
Figure 11
Short- and long-term increase in calbindin, and lack of P4–14 vigabatrin (GVG) effect on the number and size of CB-IR cells. The number and cell area of CB-IR cells were evaluated in CA1 and CA3 fields of the hippocampus and in layers of the cingulate cortex (L2–3, L4, and L5–6) at 16 weeks (a–d). Examples of CB and actin in homogenates of 2- and 16-week-old mice hippocampi (e, g) of Ct4–14 and GVG4–14 groups. CB expression normalized to actin at 2 and 16 weeks (f, h). For immunohistochemistry (IHC): n=3–6 mice; 2–5 sections, at each point for each group. For immunoblot: n=4–9, at each point for each group. The results of each trial were normalized to the trial mean. Four to five independent repeats of each sample were averaged (each repeat includes a duplicate of each sample). *p<0.05; repeated-measures analysis of variance (ANOVA) and Student's t-test were used for all analyses. Results are presented as mean±SEM.

Similar articles

Cited by

References

    1. Aguado F, Carmona MA, Pozas E, Aguiló A, Martínez-Guijarro FJ, Alcantara S, et al. BDNF regulates spontaneous correlated activity at early developmental stages by increasing synaptogenesis, expression of the K+/Cl− co-transporter KCC2. Development. 2003;130:1267–1280. - PubMed
    1. Andersen SL. Trajectories of brain development: point of vulnerability or window of opportunity. Neurosci Biobehav Rev. 2003;27:3–18. - PubMed
    1. Balakrishnan V, Becker M, Löhrke S, Nothwang HG, Güresir E, Friauf E. Expression, function of chloride transporters during development of inhibitory neurotransmission in the auditory brainstem. J Neurosci. 2003;23:4134–4145. - PMC - PubMed
    1. Ben-Ari Y. Excitatory actions of gaba during development: the nature of the nurture. Nat Rev Neurosci. 2002;3:728–739. - PubMed
    1. Ben-Ari Y, Cherubini E, Corradetti R, Gaiarsa JL. Giant synaptic potentials in immature rat CA3 hippocampal neurons. J Physiol. 1989;416:303–325. - PMC - PubMed

Publication types

MeSH terms