

Dose and context dependent effects of Myc on epidermal stem cell proliferation and differentiation
- PMID: 20043278
- PMCID: PMC2929372
- DOI: 10.1002/emmm.200900047
Dose and context dependent effects of Myc on epidermal stem cell proliferation and differentiation
Abstract
Myc is activated in many tumours, yet, paradoxically, stimulates differentiation in mammalian epidermis. To test whether the epidermis responds differently to different levels of Myc, we treated K14MycER transgenic mice with a range of concentrations of the inducing agent, 4-hydroxy-tamoxifen (4OHT). Proliferation was stimulated at all levels of Myc activity; sebocyte differentiation was stimulated at low and intermediate levels; and interfollicular epidermal differentiation at intermediate and high levels. Mutational inactivation of the Myc p21 activated kinase 2 (PAK2) phosphorylation sites increased Myc activity and further enhanced epidermal differentiation. We conclude that Myc induced differentiation acts as a fail-safe device to prevent uncontrolled proliferation and neoplastic conversion of epidermal stem cells expressing high levels of Myc.
Figures
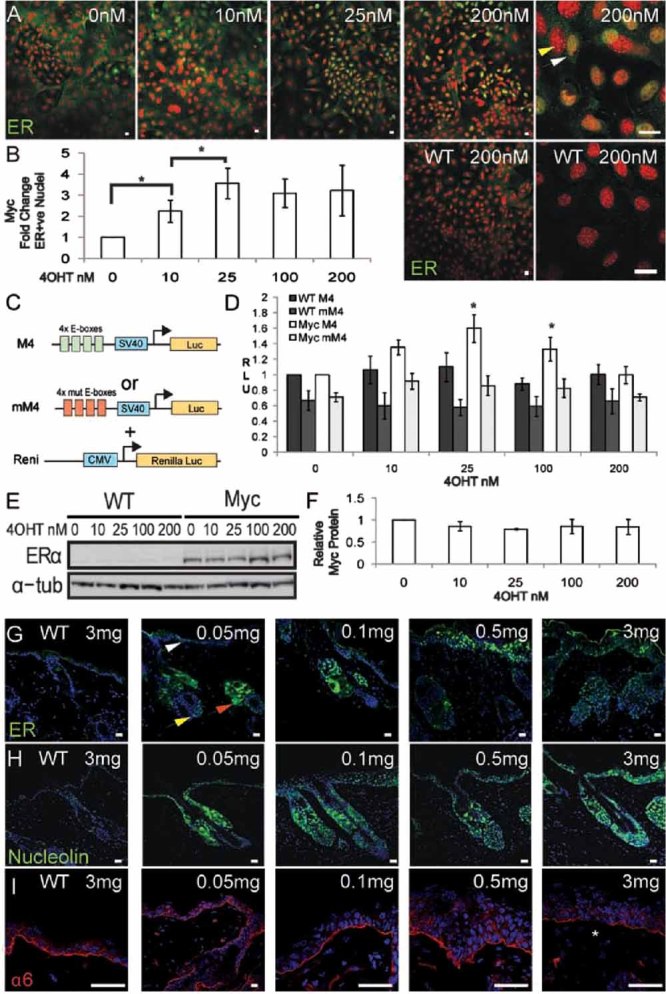
A. Anti-ER staining of immortalized K14MycER and WT keratinocytes. Yellow arrowhead: negative nucleus, white arrowhead: positive nucleus.
B. Fold change in ER-positive nuclei relative to untreated K14MycER cells. Data are mean ± SEM of three independent experiments. Asterisks: p<0.05.
C. Constructs used in luciferase assays.
D. Cells were transfected with the constructs indicated. Firefly luciferase was normalized against R. luciferase activity. Relative light units (RLUs) are shown. Mean ± SEM of six experiments performed in duplicate. Asterisks: p<0.05 relative to WT cells transfected with M4 treated with same 4OHT concentration.
E. Western blot probed with anti-ER or, as loading control, α-tubulin (tub) antibody.
F. Quantitation of ER protein by densitometry, showing mean ± SEM of at least three blots.
G–I. Dorsal skin of WT and K14MycER mice treated with 4OHT doses indicated, stained with antibodies to ER (G), nucleolin (H) or α6 integrin (I). White arrow: positive IFE cells; red arrow: positive SG cells; yellow arrow: positive HF bulb cells. Asterisk in (I): focal loss of α6. Scale bars: 10 µm (A, G-H, I, 0.05 mg), 50 µm (I, other doses).
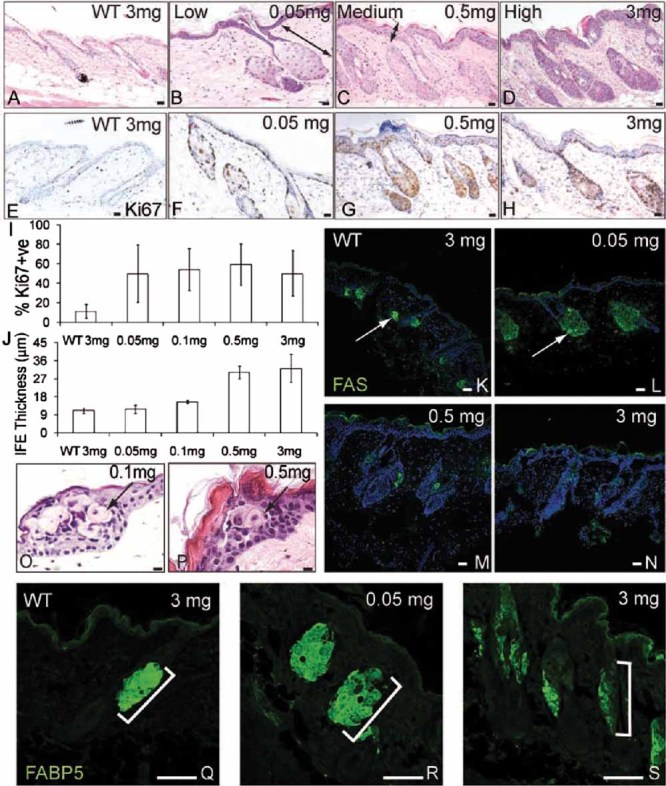
A–D. Haematoxylin and eosin (H&E) staining. Doubleheaded arrows: SG enlargement (B); IFE thickening (C).
E–H. Ki67 immunostaining.
I. % Ki67 positive cells ± SEM in IFE basal layer.
J. Maximum IFE thickness (µm) ± SEM.
K–N, Q–S. Immunofluorescence staining for FAS (green, K–N) with DAPI nuclear counterstain (blue, K–N) or FABP5 (Q–S). Arrows indicate FAS expression. Brackets demarcate SG.
O,P. H&E staining of IFE. Arrows show ectopic sebocytes. Scale bars: 10 µm (A–H, K–P), 75 µm (Q–S).
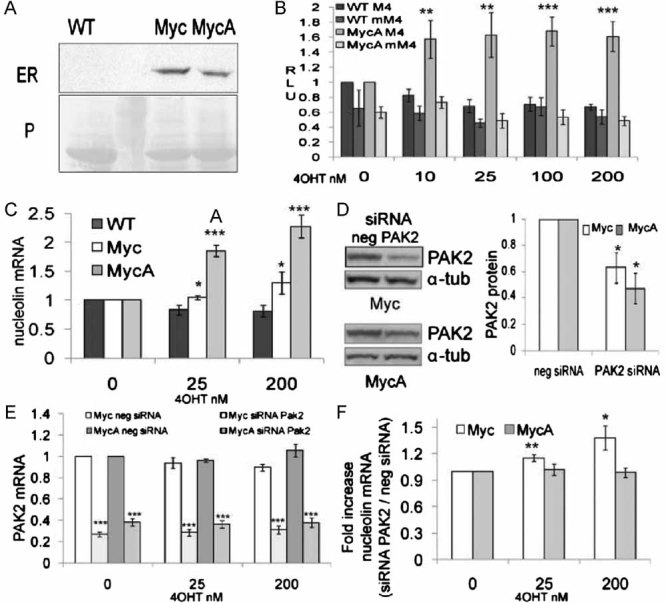
Western blot of dorsal skin lysates probed with anti-ER. Equal protein loading was verified by Ponceau staining (P). Second lane from left: molecular mass markers.
Luciferase assays performed as in Fig 1C, D. **p<0.01, ***p<0.005 relative to WT cells transfected with M4 treated with same 4OHT concentration.
Q-PCR of nucleolin mRNA. *p<0.05, ***p<0.005 relative to WT cells at same 4OHT concentration.
Western blotting of PAK2 and α-tubulin (α-tub; loading control) in cells transfected with PAK2 or control (neg) siRNAs. Densitometric analysis of three blots ± SEM is shown. Asterisks: *p<0.05 relative to neg cells.
Q-PCR of PAK2 mRNA levels in cells transfected with control (neg) or PAK2 siRNA. ***p<0.005 relative to negative control siRNA transfected cells, treated with the same 4OHT concentration.
Fold increase in nucleolin expression in cells transfected with PAK2 siRNA relative to control siRNA. *p<0.05, **p<0.01 relative to 0 nM 4OHT treated cells. (C, E, F) GAPDH was used for normalization. (B, C, E, F) Data are mean ± SEM from 5 (B, E, F) or 4 (C) experiments.
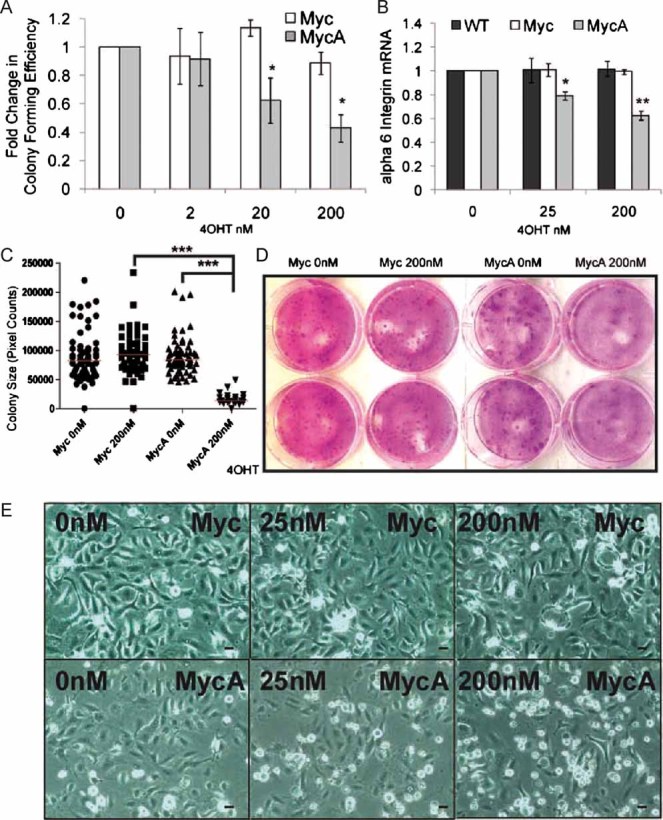
Mean fold change in CFE ± SEM in keratinocytes cultured for 8 days in the presence or absence of 4OHT. Data pooled from triplicate dishes in three independent experiments. *p<0.05 relative to Myc expressing cells treated with same 4OHT concentration.
Q-PCR of α6 integrin mRNA normalized to GAPDH. Data are mean ± SEM of three experiments. *p<0.05, **p<0.01 relative to WT treated with same 4OHT concentration.
Size of largest colonies after 8 days in 0 or 200 nM 4OHT. At least 21 colonies from triplicate dishes are shown. Red bars: median values. ***p<0.005.
Dishes of keratinocytes in CFE experiments, fixed after 8 (Myc) or 12 (MycA) days.
Phase contrast micrographs of keratinocytes in unsupplemented Keratinocyte Serum Free Medium (KSFM) treated with 4OHT for 24 h. Scale bars: 10 µm.
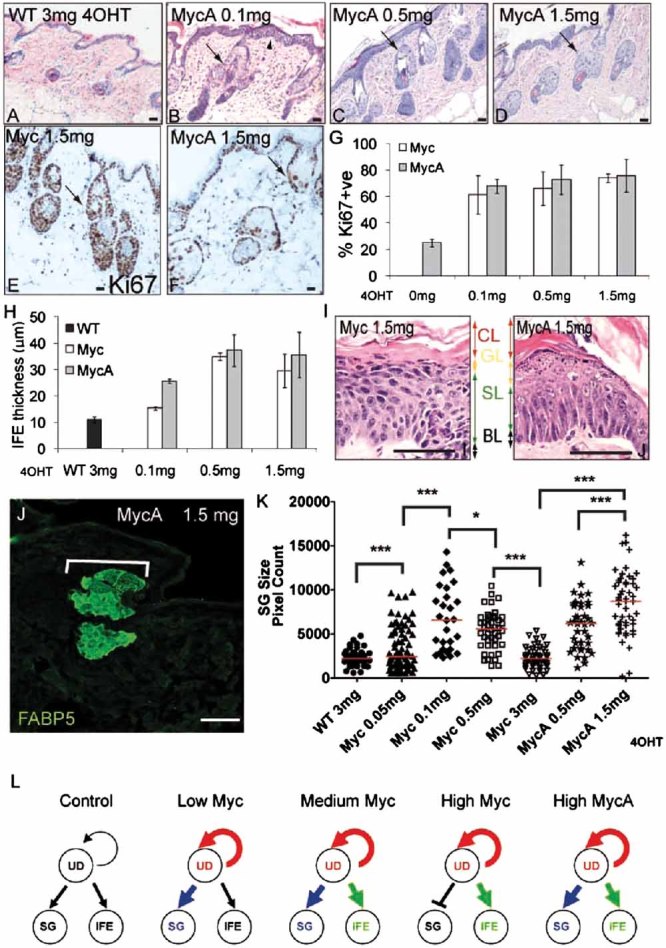
A–D. H&E stained sections of back skin. Arrowhead in (B) shows IFE thickening. Arrows (B–D): differentiated sebocytes.
E,F. Ki67 labelling of back skin. Arrows: SG.
G. % Ki67 positive IFE basal layer cells ± SEM.
H. Maximum IFE thickness (µm) ± SEM.
I. IFE basal (BL), spinous (SL), granular (GL) and cornified (CL) layers; 8 days, 0.5 mg 4OHT.
J. FABP5 staining. Bracket: SG.
K. Scatterplot of FABP5 positive area of individual SG; at least 28 SGs per condition. Red bar: median. *p<0.05, ***p<0.005.
L. Summary of effects of Myc and MycA on proliferation of undifferentiated keratinocytes (UD) and differentiation into SG and IFE. Thickened arrows indicate stimulation relative to control, untreated epidermis. Scale bars: 10 µm (A–F), 50 µm (I), 75 µm (J).
References
-
- Arnold I, Watt FM. c-Myc activation in transgenic mouse epidermis results in mobilization of stem cells and differentiation of their progeny. Curr Biol. 2001;11:558–568. - PubMed
-
- Benitah SA, Frye M, Glogauer M, Watt FM. Stem cell depletion through epidermal deletion of Rac1. Science. 2005;309:933–935. - PubMed
-
- Frye M, Gardner C, Li ER, Arnold I, Watt FM. Evidence that Myc activation depletes the epidermal stem cell compartment by modulating adhesive interactions with the local microenvironment. Development. 2003;130:2793–2808. - PubMed
Publication types
MeSH terms
Substances
Grants and funding
LinkOut - more resources
Full Text Sources
Medical
Molecular Biology Databases
Miscellaneous
