

ENaC-mediated alveolar fluid clearance and lung fluid balance depend on the channel-activating protease 1
- PMID: 20043279
- PMCID: PMC3377187
- DOI: 10.1002/emmm.200900050
ENaC-mediated alveolar fluid clearance and lung fluid balance depend on the channel-activating protease 1
Abstract
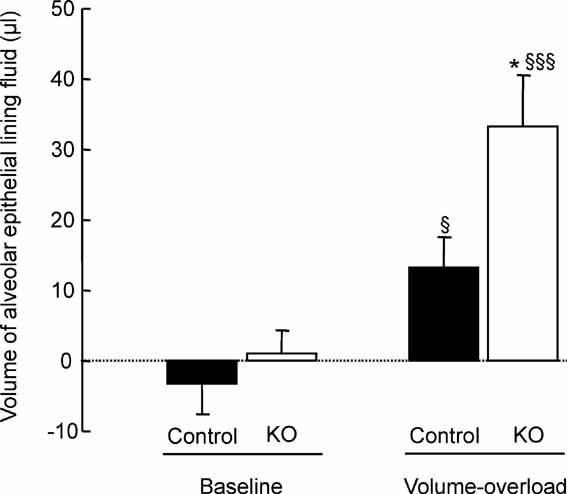
Sodium transport via epithelial sodium channels (ENaC) expressed in alveolar epithelial cells (AEC) provides the driving force for removal of fluid from the alveolar space. The membrane-bound channel-activating protease 1 (CAP1/Prss8) activates ENaC in vitro in various expression systems. To study the role of CAP1/Prss8 in alveolar sodium transport and lung fluid balance in vivo, we generated mice lacking CAP1/Prss8 in the alveolar epithelium using conditional Cre-loxP-mediated recombination. Deficiency of CAP1/Prss8 in AEC induced in vitro a 40% decrease in ENaC-mediated sodium currents. Sodium-driven alveolar fluid clearance (AFC) was reduced in CAP1/Prss8-deficient mice, due to a 48% decrease in amiloride-sensitive clearance, and was less sensitive to beta(2)-agonist treatment. Intra-alveolar treatment with neutrophil elastase, a soluble serine protease activating ENaC at the cell surface, fully restored basal AFC and the stimulation by beta(2)-agonists. Finally, acute volume-overload increased alveolar lining fluid volume in CAP1/Prss8-deficient mice. This study reveals that CAP1 plays a crucial role in the regulation of ENaC-mediated alveolar sodium and water transport and in mouse lung fluid balance.
Figures
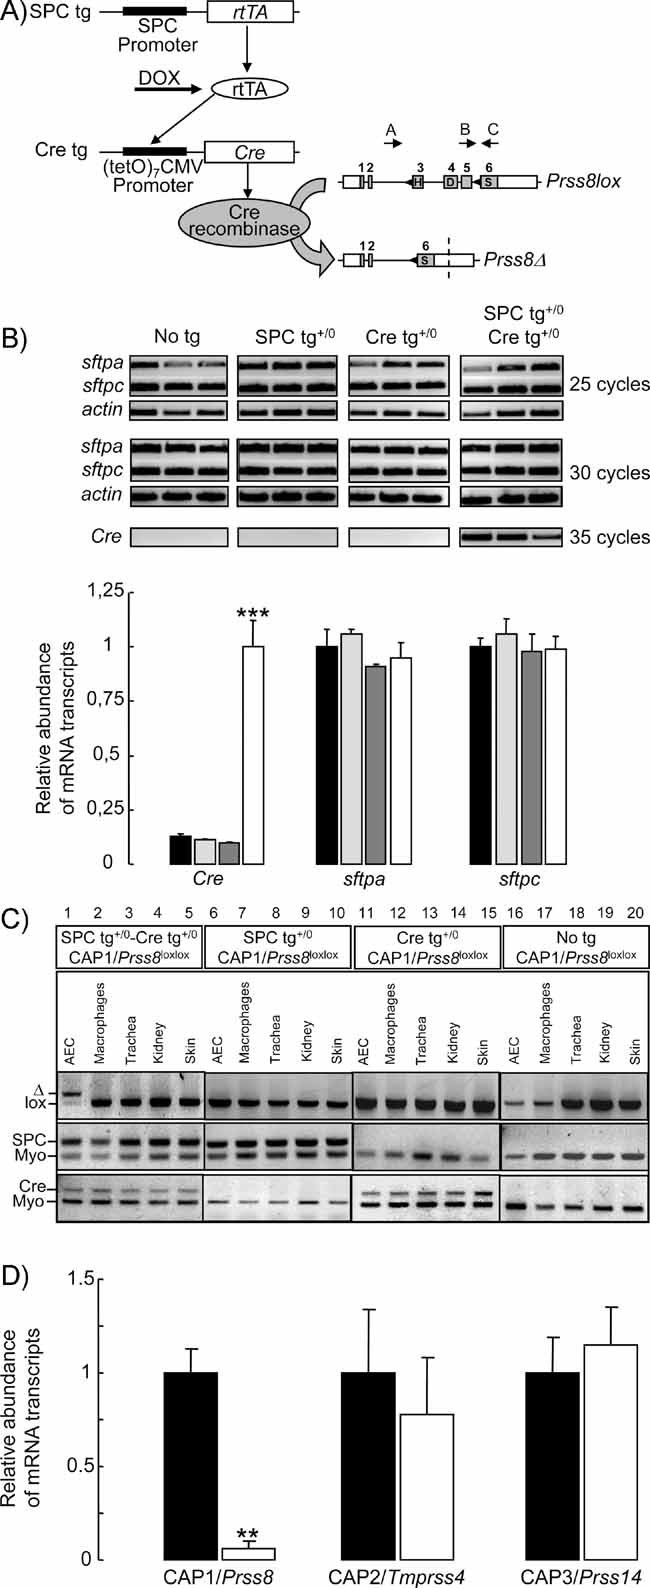
Triple transgenic mice were generated that harbour the rtTA protein under the control of the SPC promoter in distal lung epithelial cells (SPC tg). Upon doxycycline (DOX) treatment, rtTA activates expression of the (tetO)7-CMV-Cre recombinase transgene (Cre tg). Cre recombinase recognizes the loxP sites (black triangles) in the floxed CAP1/Prss8 gene locus, causing deletion of the exons 3–5 to generate a null allele (Prss8Δ). Coding (grey boxes) and noncoding exon sequences (white boxes) are indicated.
Expression of surfactant proteins A (sftpa) and C (sftpc), and of Cre recombinase (Cre) mRNA transcripts by semi-quantitative RT-PCR run at 25, 30 and 35 cycles in distal lung extracts from control (no tg: black bars; SPC tg+/0: light grey bars; Cre tg+/0: dark grey bars) and knockout (SPC tg+/0; Cre tg+/0, white bars) groups. Quantification of signals was performed after 30 cycles for sftpa and sftpc, and after 35 cycles for Cre. Results are expressed as the ratio of sftpa, sftpc or Cre mRNA/β-actin mRNA (n = 3 mice per group). ***: Significantly different from control groups (p < 0.001).
PCR analysis with primers A–C distinguish between lox (413 bp) and Δ (473 bp) alleles of CAP1/Prss8 gene locus (top). Note the shift of the Prss8lox allele into Prss8Δ allele in AEC harbouring the SPC and Cre transgenes (lane 1). Detection of SPC tg (middle) and Cre tg (bottom), and of myogenin (middle and bottom).
Quantification of CAP1/Prss8, CAP2 and CAP3 mRNA transcripts by qRT-PCR in AEC isolated from pooled control mice (no transgene or only SPC or Cre transgene: black bars) and knockout mice (SPCtg+/0; Cretg+/0: white bars). Results are expressed as the ratio of CAP1/Prss8, CAP2/Tmprss4 or CAP3/Prss14 mRNA/β-actin mRNA (n = 4 mice per group).**: Significantly different from control group (p < 0.01).
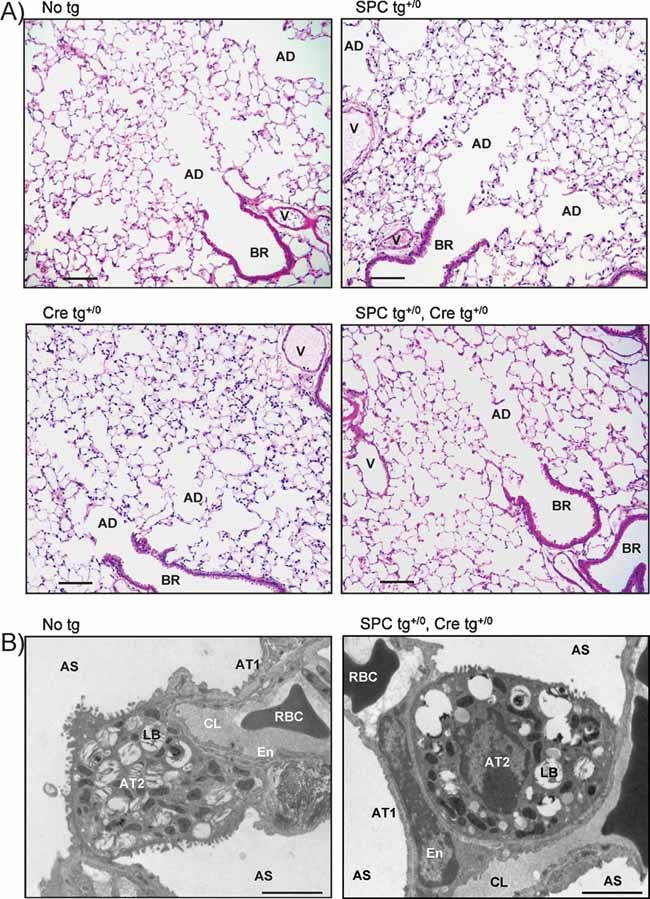
Light photomicrographs of representative lung sections from control and knockout littermates stained with haematoxylin and eosin. The morphological aspect of blood vessels (V), bronchioles (BR), alveolar ducts (AD) and alveoli was normal in knockout mice. Scale bar, 100 µm.
Electron micrographs showing that the ultrastructure of alveolar septa and alveolar epithelium was normal in both groups. AS, alveolar space; AT1, alveolar type 1 cells; AT2, alveolar type 2 cells; LB, lamellar body; En, endothelial cell; CL, pulmonary capillary lumen; RBC, red blood cell. Scale bar, 2 µm.
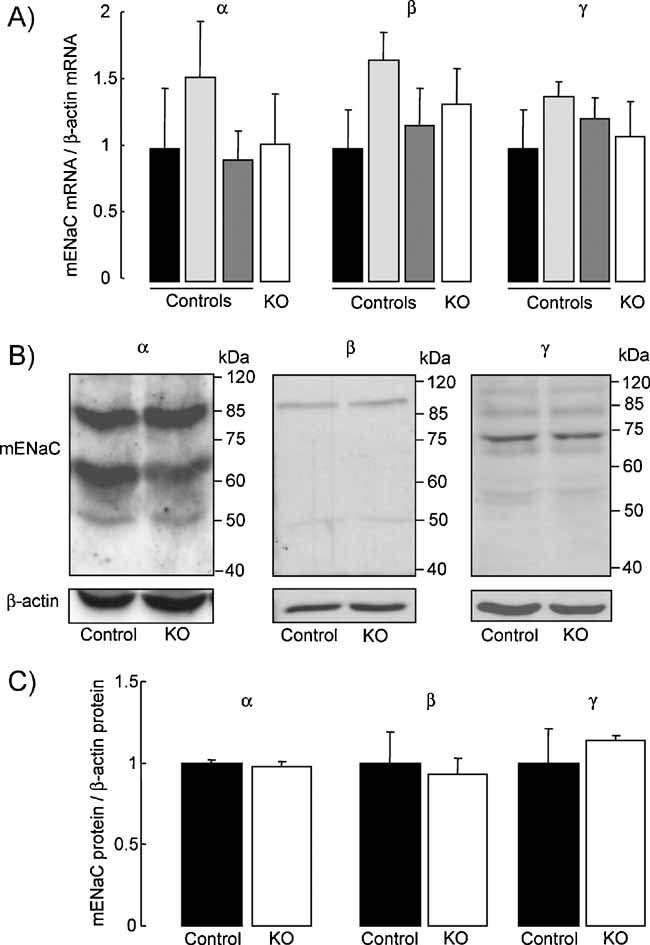
Quantification of mouse ENaC subunit mRNA transcript expression by semi-quantitative RT-PCR run at 30 cycles in distal lung homogenate extracts from control (no tg: black bars; SPC tg+/0: light grey bars; Cre tg+/0: dark grey bars) and knockout mice (SPC tg+/0; Cre tg+/0, white bars). Results are expressed as the ratio of α-, β- or γ-mENaC mRNA/β-actin mRNA (n = 3 mice per group).
Representative immunoblots showing the expression of ENaC subunit proteins and β-actin protein in distal lung homogenate extracts from control and knockout mice.
Quantification of α-, β- and γ-mENaC signals in pooled control (black bars) and knockout (KO, white bars) mouse lung homogenates was obtained using NIH image software. Results are expressed as the ratio of mENaC protein/β-actin protein (n = 4 mice per group). There was no significant difference between the two groups with respect to the mRNA transcript or protein expression levels.
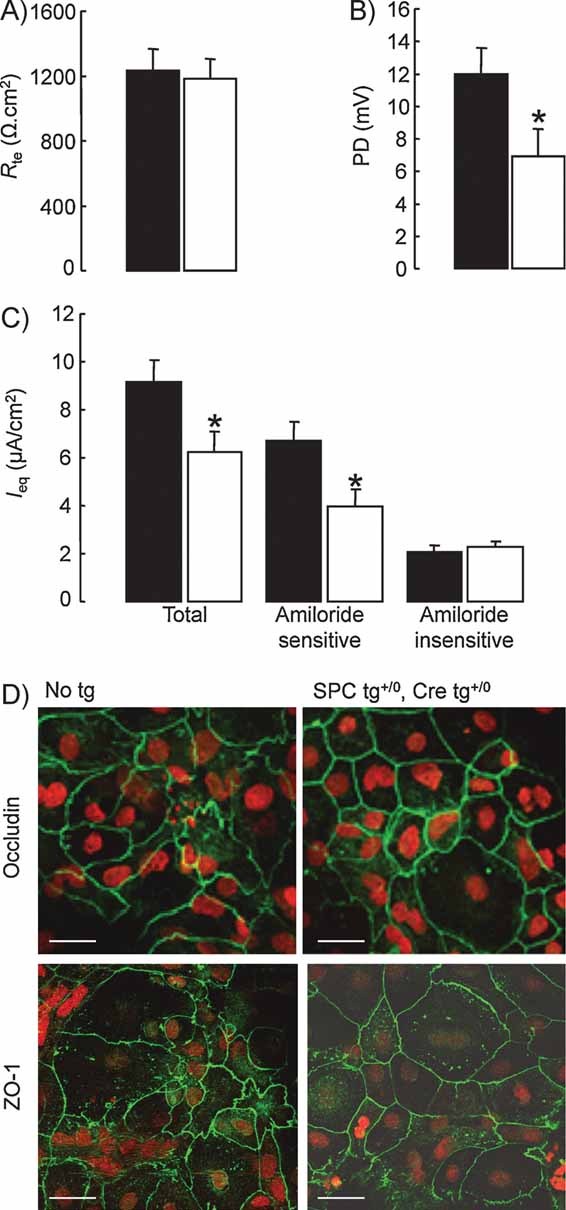
Transepithelial resistance (Rte) and (B) PD were measured under open-circuit conditions in control (black bars) and knockout (white bars) AEC monolayers grown on transwell filters for 5 days.
Equivalent short-circuit current (Ieq) was calculated from Rte and PD at baseline (total Ieq), and after apical treatment with amiloride (10 µM) (amiloride-insensitive Ieq) (9–12 filters per group from 3 independent cultures). Amiloride-sensitive Ieq is the difference between Ieq values in the absence and in the presence of amiloride. Transepithelial PD as well as total and amiloride-sensitive Ieq were significantly reduced in knockout AEC monolayers. *: Significantly different from control group (p < 0.05).
AEC from control (No tg) and knockout mice (SPC tg+/0; Cre tg+/0) were cultured for 5 days on transwell filters before immunofluorescent detection of occludin and ZO-1 was performed. Nuclei are counterstained with Sytox Orange. Occludin staining was localized at the periphery of the cells in both groups. Scale bar, 25 µm.
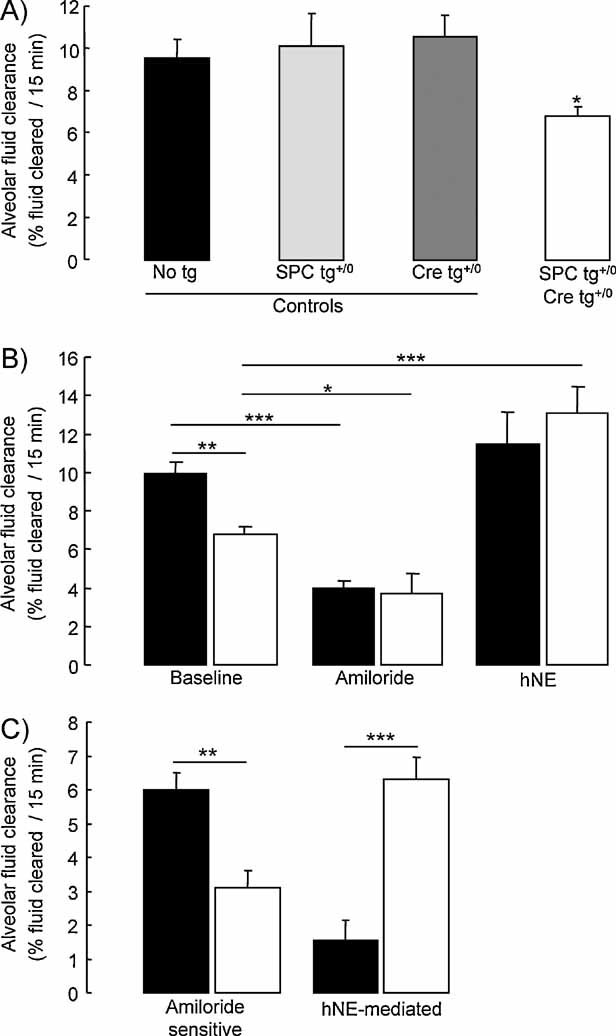
Sodium-driven AFC was measured at baseline over a 15-min period in control (black, light grey and dark grey bars) and knockout (white bars) CAP1/Prss8lox/lox littermates aged 2–5 months at 37°C using an in situ nonventilated model in which the airspace was instilled with an isoosmolar Ringer's lactate solution containing 125I-albumin as a volume marker. Note that AFC was significantly lower in the knockout group than in the control groups (*: significantly different from control groups, p < 0.05).
AFC was measured in the absence (baseline) or presence of amiloride (final concentration: 1 mM) or hNE (final concentration: 33 µg/ml) in the alveolar instillate in pooled control littermates (black bars) and knockout (white bars) littermates.
Calculated values of amiloride-sensitive AFC (difference between AFC values in the absence and in the presence of amiloride) and hNE-mediated AFC (difference between AFC values in the absence and in the presence of hNE). Results are expressed as percentage fluid absorption at 15 min (5–13 mice per group for basal and hNE experiments, 4 mice per group for amiloride experiments. *, **, ***: Significant difference between groups as indicated (*, p < 0.05; **, p < 0.01; and ***, p < 0.001, respectively).
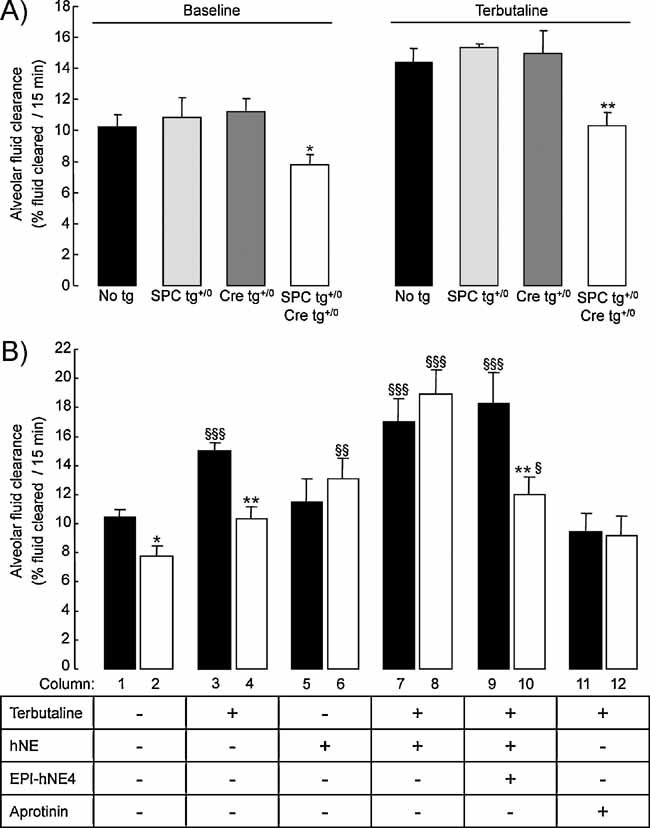
Sodium-driven AFC was measured at baseline and in the presence of terbutaline (final concentration in alveolar instillate: 10−4 M) over a 15-min period in control (black, light grey and dark grey bars) and knockout (white bars) CAP1/Prss8lox/lox littermates aged 2–5 months at 37°C as described in Methods. AFC values at baseline and in the presence of terbutaline were significantly lower in the knockout group than in control groups (*, **: significantly different from control groups, p < 0.05 and p < 0.01, respectively).
AFC was measured in the absence or presence of terbutaline, hNE (33 µg/ml), the elastase inhibitor EPI-hNE4 (50 µg/ml), or the serine protease inhibitor aprotinin (100 µg/mL) in the alveolar instillate in pooled control littermates (black bars) and knockout (white bars) littermates. Results are expressed as percentage fluid absorption at 15 min (n = 5–12 mice per group and per condition). *, **: Significantly different from respective control group (p < 0.05, p < 0.01, respectively); §, §§, §§§: significantly different from baseline value (no treatment) in the corresponding group (p < 0.05, p < 0.01 and p < 0.001, respectively).
Similar articles
-
In vitro and in vivo regulation of transepithelial lung alveolar sodium transport by serine proteases.Am J Physiol Lung Cell Mol Physiol. 2005 Jun;288(6):L1099-109. doi: 10.1152/ajplung.00332.2004. Epub 2005 Jan 28. Am J Physiol Lung Cell Mol Physiol. 2005. PMID: 15681398
-
beta-Liddle mutation of the epithelial sodium channel increases alveolar fluid clearance and reduces the severity of hydrostatic pulmonary oedema in mice.J Physiol. 2007 Jul 15;582(Pt 2):777-88. doi: 10.1113/jphysiol.2007.131078. Epub 2007 Apr 12. J Physiol. 2007. PMID: 17430990 Free PMC article.
-
Importance of ENaC-mediated sodium transport in alveolar fluid clearance using genetically-engineered mice.Cell Physiol Biochem. 2010;25(1):63-70. doi: 10.1159/000272051. Epub 2009 Dec 22. Cell Physiol Biochem. 2010. PMID: 20054145 Review.
-
Kidney-Specific CAP1/Prss8-Deficient Mice Maintain ENaC-Mediated Sodium Balance through an Aldosterone Independent Pathway.Int J Mol Sci. 2022 Jun 16;23(12):6745. doi: 10.3390/ijms23126745. Int J Mol Sci. 2022. PMID: 35743186 Free PMC article.
-
Alveolar epithelial fluid transport in acute lung injury: new insights.Eur Respir J. 2002 Nov;20(5):1299-313. doi: 10.1183/09031936.02.00401602. Eur Respir J. 2002. PMID: 12449188 Review.
Cited by
-
The channel-activating protease CAP1/Prss8 is required for placental labyrinth maturation.PLoS One. 2013;8(2):e55796. doi: 10.1371/journal.pone.0055796. Epub 2013 Feb 6. PLoS One. 2013. PMID: 23405214 Free PMC article.
-
A matriptase-prostasin reciprocal zymogen activation complex with unique features: prostasin as a non-enzymatic co-factor for matriptase activation.J Biol Chem. 2013 Jun 28;288(26):19028-39. doi: 10.1074/jbc.M113.469932. Epub 2013 May 14. J Biol Chem. 2013. PMID: 23673661 Free PMC article.
-
Regulating ENaC's gate.Am J Physiol Cell Physiol. 2020 Jan 1;318(1):C150-C162. doi: 10.1152/ajpcell.00418.2019. Epub 2019 Nov 13. Am J Physiol Cell Physiol. 2020. PMID: 31721612 Free PMC article. Review.
-
Emerging roles of mechanosensitive ion channels in acute lung injury/acute respiratory distress syndrome.Respir Res. 2022 Dec 20;23(1):366. doi: 10.1186/s12931-022-02303-3. Respir Res. 2022. PMID: 36539808 Free PMC article. Review.
-
Hypotonic shock modulates Na(+) current via a Cl(-) and Ca(2+)/calmodulin dependent mechanism in alveolar epithelial cells.PLoS One. 2013 Sep 3;8(9):e74565. doi: 10.1371/journal.pone.0074565. eCollection 2013. PLoS One. 2013. PMID: 24019969 Free PMC article.
References
-
- Bruns JB, Carattino MD, Sheng S, Maarouf AB, Weisz OA, Pilewski J, Hughey RP, Kleyman TR. Epithelial Na+ channels are fully activated by furin- and prostasin-dependent release of an inhibitory peptide from the γ-subunit. J Biol Chem. 2007;282:6153–6160. - PubMed
-
- Caldwell RA, Boucher RC, Stutts MJ. Serine protease activation of near-silent epithelial Na+ channels. Am J Physiol Cell Physiol. 2004;286:C190–C194. - PubMed
-
- Caldwell RA, Boucher RC, Stutts MJ. Neutrophil elastase activates near-silent epithelial Na+ channels and increases airway epithelial Na+ transport. Am J Physiol Lung Cell Mol Physiol. 2005;288:L813–L819. - PubMed
Publication types
MeSH terms
Substances
LinkOut - more resources
Full Text Sources
Other Literature Sources
Medical
Molecular Biology Databases
Research Materials
Miscellaneous
