

The influence of coughing on cerebrospinal fluid pressure in an in vitro syringomyelia model with spinal subarachnoid space stenosis
- PMID: 20043856
- PMCID: PMC2806373
- DOI: 10.1186/1743-8454-6-17
The influence of coughing on cerebrospinal fluid pressure in an in vitro syringomyelia model with spinal subarachnoid space stenosis
Abstract
Background: The influence of coughing, on the biomechanical environment in the spinal subarachnoid space (SAS) in the presence of a cerebrospinal fluid flow stenosis, is thought to be an important etiological factor in craniospinal disorders, including syringomyelia (SM), Chiari I malformation, and hydrocephalus. The aim of this study was to investigate SAS and syrinx pressures during simulated coughing using in vitro models and to provide information for the understanding of the craniospinal fluid system dynamics to help develop better computational models.
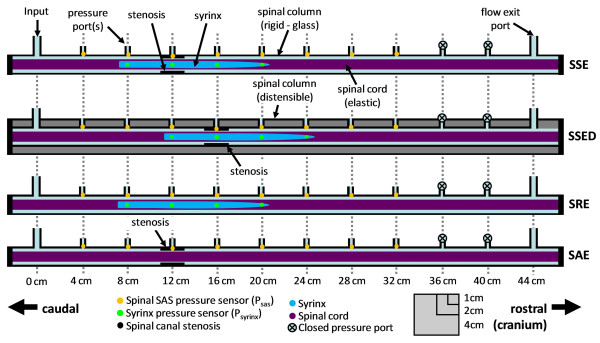
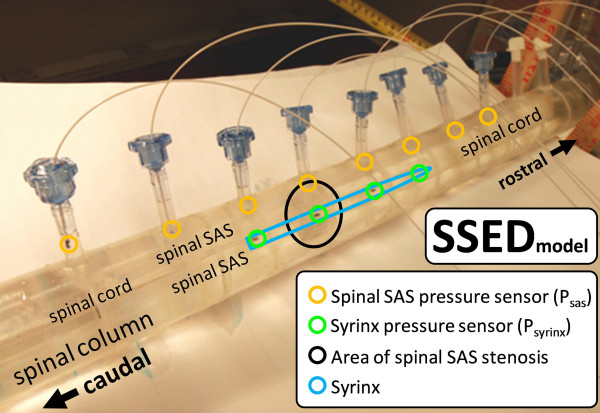
Methods: Four in vitro models were constructed to be simplified representations of: 1) non-communicating SM with spinal SAS stenosis; 2) non-communicating SM due to spinal SAS stenosis with a distensible spinal column; 3) non-communicating SM post surgical removal of a spinal SAS stenosis; and 4) a spinal SAS stenosis due to spinal trauma. All of the models had a flexible spinal cord. To simulate coughing conditions, an abrupt CSF pressure pulse (~ 5 ms) was imposed at the caudal end of the spinal SAS by a computer-controlled pump. Pressure measurements were obtained at 4 cm intervals along the spinal SAS and syrinx using catheter tip transducers.
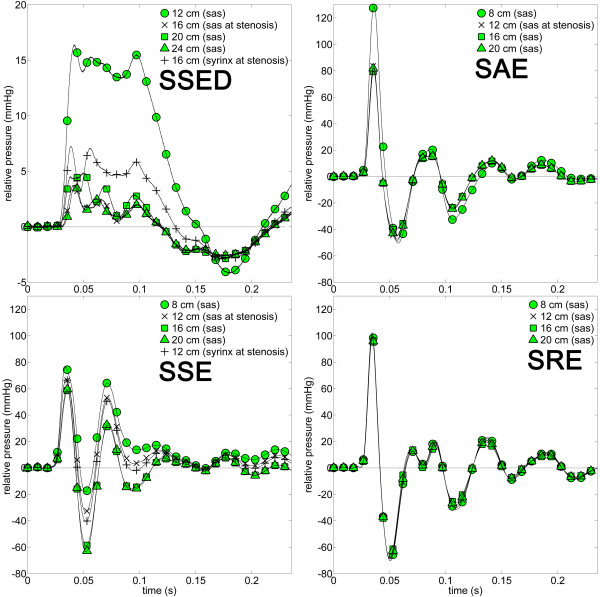
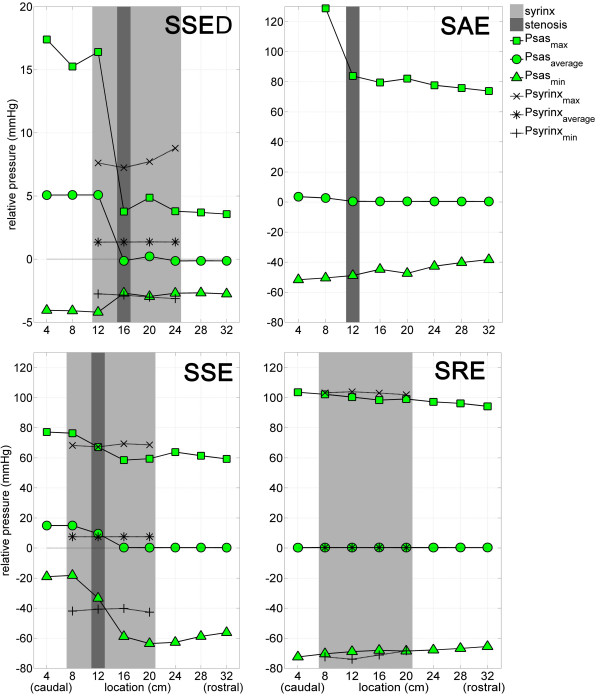
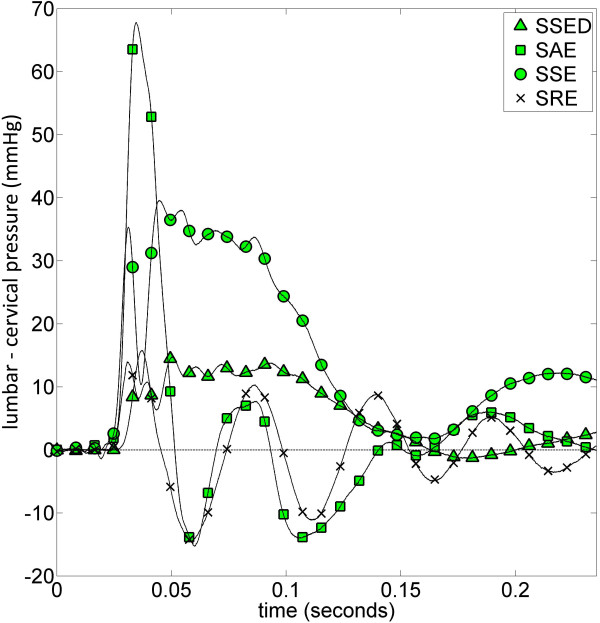
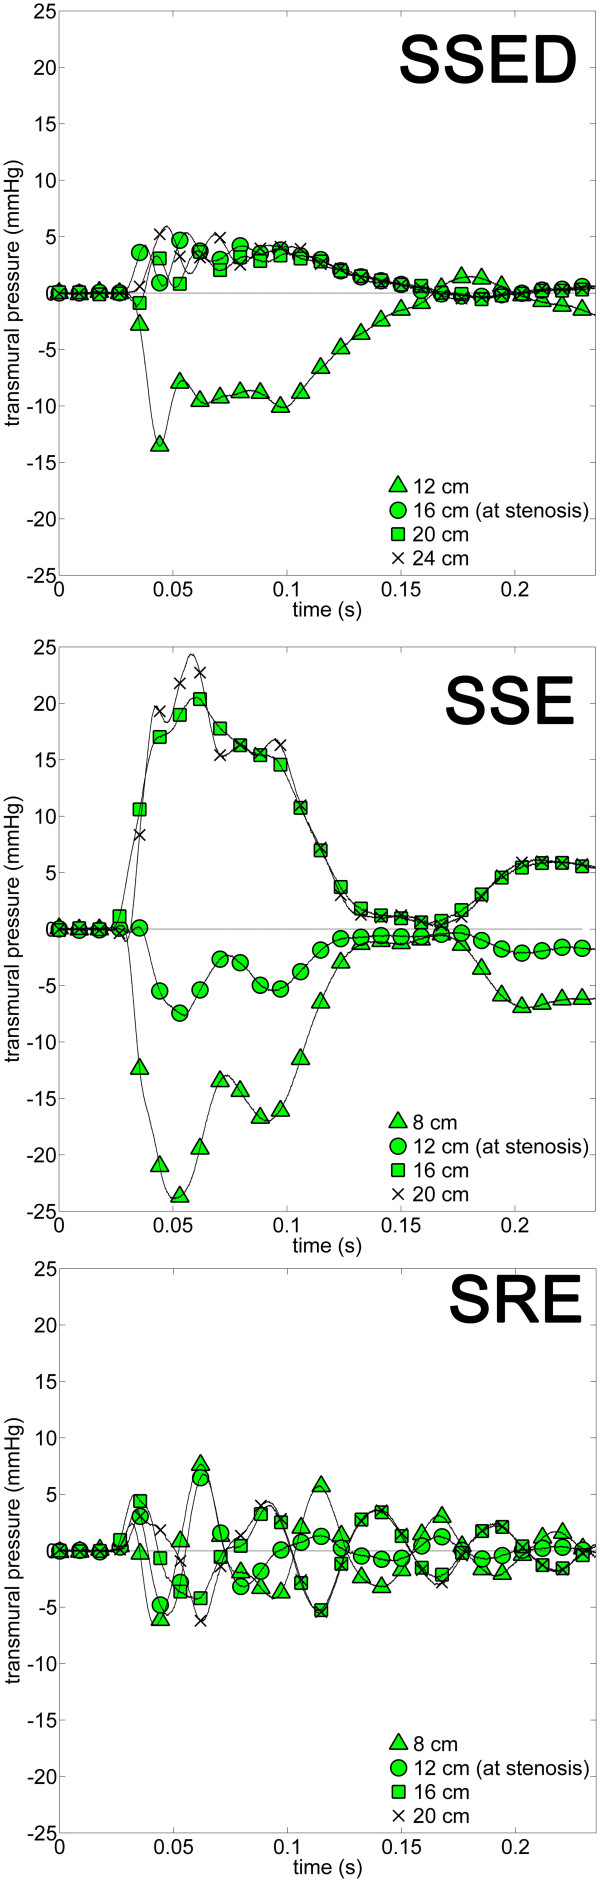
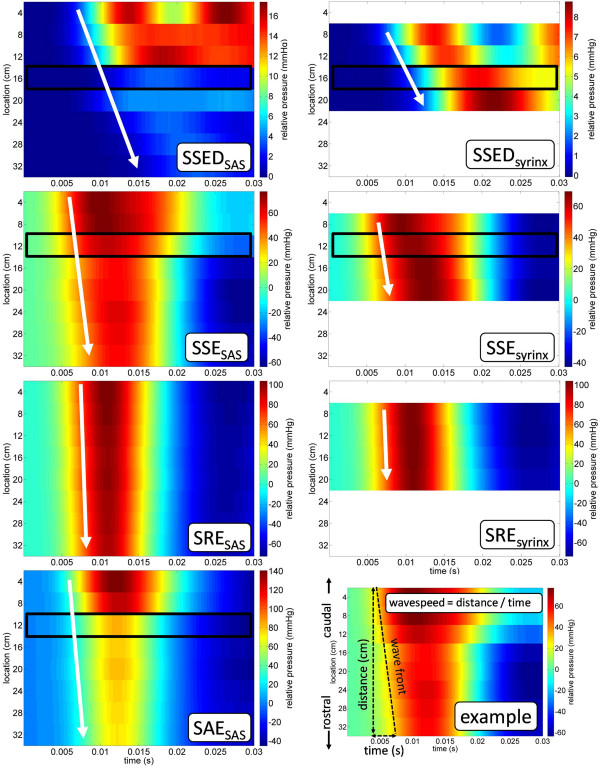
Results: Pressure measurements during a simulated cough, showed that removal of the stenosis was a key factor in reducing pressure gradients in the spinal SAS. The presence of a stenosis resulted in a caudocranial pressure drop in the SAS, whereas pressure within the syrinx cavity varied little caudocranially. A stenosis in the SAS caused the syrinx to balloon outward at the rostral end and be compressed at the caudal end. A >90% SAS stenosis did not result in a significant Venturi effect. Increasing compliance of the spinal column reduced forces acting on the spinal cord. The presence of a syrinx in the cord when there was a stenosis in the SAS, reduced pressure forces in the SAS. Longitudinal pressure dissociation acted to suck fluid and tissue caudocranially in the SAS with a stenosis.
Conclusions: Pressures in the spinal SAS during a simulated cough in vitro had similar peak, transmural, and longitudinal pressures to in vivo measurements reported in the literature. The pressure wave velocities and pressure gradients during coughing (longitudinal pressure dissociation and transmural pressure) were impacted by alterations in geometry, compliance, and the presence of a syrinx and/or stenosis.
Figures
Similar articles
-
Spinal subarachnoid space pressure measurements in an in vitro spinal stenosis model: implications on syringomyelia theories.J Biomech Eng. 2010 Nov;132(11):111007. doi: 10.1115/1.4000089. J Biomech Eng. 2010. PMID: 21034148
-
Syringomyelia hydrodynamics: an in vitro study based on in vivo measurements.J Biomech Eng. 2005 Dec;127(7):1110-20. doi: 10.1115/1.2073687. J Biomech Eng. 2005. PMID: 16502653
-
Evaluation by fluid/structure-interaction spinal-cord simulation of the effects of subarachnoid-space stenosis on an adjacent syrinx.J Biomech Eng. 2010 Jun;132(6):061009. doi: 10.1115/1.4001165. J Biomech Eng. 2010. PMID: 20887034
-
Unraveling the riddle of syringomyelia.Neurosurg Rev. 2006 Oct;29(4):251-63; discussion 264. doi: 10.1007/s10143-006-0029-5. Epub 2006 May 31. Neurosurg Rev. 2006. PMID: 16752160 Review.
-
The pathogenesis of syringomyelia associated with lesions at the foramen magnum: a critical review of existing theories and proposal of a new hypothesis.J Neurol Sci. 2004 May 15;220(1-2):3-21. doi: 10.1016/j.jns.2004.01.014. J Neurol Sci. 2004. PMID: 15140600 Review.
Cited by
-
Vertical diplopia and oscillopsia due to midbrain keyhole aqueduct syndrome associated with severe cough.Am J Ophthalmol Case Rep. 2018 Feb 15;10:128-131. doi: 10.1016/j.ajoc.2018.02.009. eCollection 2018 Jun. Am J Ophthalmol Case Rep. 2018. PMID: 29687086 Free PMC article.
-
Water and brain function: effects of hydration status on neurostimulation with transcranial magnetic stimulation.J Neurophysiol. 2024 Sep 1;132(3):791-807. doi: 10.1152/jn.00143.2023. Epub 2024 Jul 31. J Neurophysiol. 2024. PMID: 39081213 Free PMC article.
-
Effect of the central canal in the spinal cord on fluid movement within the cord.Neuroradiol J. 2013 Oct;26(5):585-90. doi: 10.1177/197140091302600513. Epub 2013 Nov 7. Neuroradiol J. 2013. PMID: 24199820 Free PMC article.
-
Computer simulation of syringomyelia in dogs.BMC Vet Res. 2018 Mar 9;14(1):82. doi: 10.1186/s12917-018-1410-7. BMC Vet Res. 2018. PMID: 29523203 Free PMC article.
-
Ex-vivo quantification of ovine pia arachnoid complex biomechanical properties under uniaxial tension.Fluids Barriers CNS. 2020 Nov 12;17(1):68. doi: 10.1186/s12987-020-00229-w. Fluids Barriers CNS. 2020. PMID: 33183314 Free PMC article.
References
LinkOut - more resources
Full Text Sources
