Multimodal surface-based morphometry reveals diffuse cortical atrophy in traumatic brain injury
- PMID: 20043859
- PMCID: PMC2811103
- DOI: 10.1186/1471-2342-9-20
Multimodal surface-based morphometry reveals diffuse cortical atrophy in traumatic brain injury
Abstract
Background: Patients with traumatic brain injury (TBI) often present with significant cognitive deficits without corresponding evidence of cortical damage on neuroradiological examinations. One explanation for this puzzling observation is that the diffuse cortical abnormalities that characterize TBI are difficult to detect with standard imaging procedures. Here we investigated a patient with severe TBI-related cognitive impairments whose scan was interpreted as normal by a board-certified radiologist in order to determine if quantitative neuroimaging could detect cortical abnormalities not evident with standard neuroimaging procedures.
Methods: Cortical abnormalities were quantified using multimodal surfaced-based morphometry (MSBM) that statistically combined information from high-resolution structural MRI and diffusion tensor imaging (DTI). Normal values of cortical anatomy and cortical and pericortical DTI properties were quantified in a population of 43 healthy control subjects. Corresponding measures from the patient were obtained in two independent imaging sessions. These data were quantified using both the average values for each lobe and the measurements from each point on the cortical surface. The results were statistically analyzed as z-scores from the mean with a p < 0.05 criterion, corrected for multiple comparisons. False positive rates were verified by comparing the data from each control subject with the data from the remaining control population using identical statistical procedures.
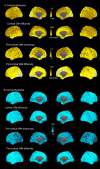
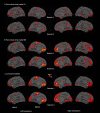
Results: The TBI patient showed significant regional abnormalities in cortical thickness, gray matter diffusivity and pericortical white matter integrity that replicated across imaging sessions. Consistent with the patient's impaired performance on neuropsychological tests of executive function, cortical abnormalities were most pronounced in the frontal lobes.
Conclusions: MSBM is a promising tool for detecting subtle cortical abnormalities with high sensitivity and selectivity. MSBM may be particularly useful in evaluating cortical structure in TBI and other neurological conditions that produce diffuse abnormalities in both cortical structure and tissue properties.
Figures


Similar articles
-
Fractal dimension brain morphometry: a novel approach to quantify white matter in traumatic brain injury.Brain Imaging Behav. 2019 Aug;13(4):914-924. doi: 10.1007/s11682-018-9892-2. Brain Imaging Behav. 2019. PMID: 29909586
-
White matter integrity and cognition in chronic traumatic brain injury: a diffusion tensor imaging study.Brain. 2007 Oct;130(Pt 10):2508-19. doi: 10.1093/brain/awm216. Epub 2007 Sep 14. Brain. 2007. PMID: 17872928
-
Diffusion properties of cortical and pericortical tissue: regional variations, reliability and methodological issues.Magn Reson Imaging. 2012 Oct;30(8):1111-22. doi: 10.1016/j.mri.2012.04.004. Epub 2012 Jun 12. Magn Reson Imaging. 2012. PMID: 22698767
-
Gray and normal-appearing white matter in multiple sclerosis: an MRI perspective.Expert Rev Neurother. 2007 Mar;7(3):271-9. doi: 10.1586/14737175.7.3.271. Expert Rev Neurother. 2007. PMID: 17341175 Review.
-
Physics, Techniques and Review of Neuroradiological Applications of Diffusion Kurtosis Imaging (DKI).Clin Neuroradiol. 2016 Dec;26(4):391-403. doi: 10.1007/s00062-015-0469-9. Epub 2015 Nov 20. Clin Neuroradiol. 2016. PMID: 26589207 Review.
Cited by
-
The Shrinking Brain: Cerebral Atrophy Following Traumatic Brain Injury.Ann Biomed Eng. 2019 Sep;47(9):1941-1959. doi: 10.1007/s10439-018-02148-2. Epub 2018 Oct 17. Ann Biomed Eng. 2019. PMID: 30341741 Free PMC article. Review.
-
Systematic review of neuroimaging correlates of executive functioning: converging evidence from different clinical populations.J Neuropsychiatry Clin Neurosci. 2014 Apr 1;26(2):114-25. doi: 10.1176/appi.neuropsych.12070176. J Neuropsychiatry Clin Neurosci. 2014. PMID: 24763759 Free PMC article.
-
A framework to analyze cerebral mean diffusivity using surface guided diffusion mapping in diffusion tensor imaging.Front Neurosci. 2015 Jul 14;9:236. doi: 10.3389/fnins.2015.00236. eCollection 2015. Front Neurosci. 2015. PMID: 26236180 Free PMC article.
-
Abnormal neurite density and orientation dispersion in frontal lobe link to elevated hyperactive/impulsive behaviours in young adults with traumatic brain injury.Brain Commun. 2022 Jan 30;4(1):fcac011. doi: 10.1093/braincomms/fcac011. eCollection 2022. Brain Commun. 2022. PMID: 35187485 Free PMC article.
-
Multimodal neuroimaging computing: a review of the applications in neuropsychiatric disorders.Brain Inform. 2015 Sep;2(3):167-180. doi: 10.1007/s40708-015-0019-x. Epub 2015 Aug 29. Brain Inform. 2015. PMID: 27747507 Free PMC article. Review.
References
-
- Levine B, Fujiwara E, O'Connor C, Richard N, Kovacevic N, Mandic M, Restagno A, Easdon C, Robertson IH, Graham SJ. In vivo characterization of traumatic brain injury neuropathology with structural and functional neuroimaging. J Neurotrauma. 2006;23(10):1396–1411. doi: 10.1089/neu.2006.23.1396. - DOI - PMC - PubMed
-
- Belanger HG, Vanderploeg RD, Curtiss G, Warden DL. Recent neuroimaging techniques in mild traumatic brain injury. J Neuropsychiatry Clin Neurosci. 2007;19(1):5–20. - PubMed
Publication types
MeSH terms
LinkOut - more resources
Full Text Sources
Other Literature Sources
Medical

