. 2010 Mar 15;48(6):798-810.
doi: 10.1016/j.freeradbiomed.2009.12.018. Epub 2010 Jan 4.

Regulation of phagocyte NADPH oxidase by hydrogen peroxide through a Ca(2+)/c-Abl signaling pathway

Affiliations

Regulation of phagocyte NADPH oxidase by hydrogen peroxide through a Ca(2+)/c-Abl signaling pathway

Amina El Jamali et al. Free Radic Biol Med. .

Abstract

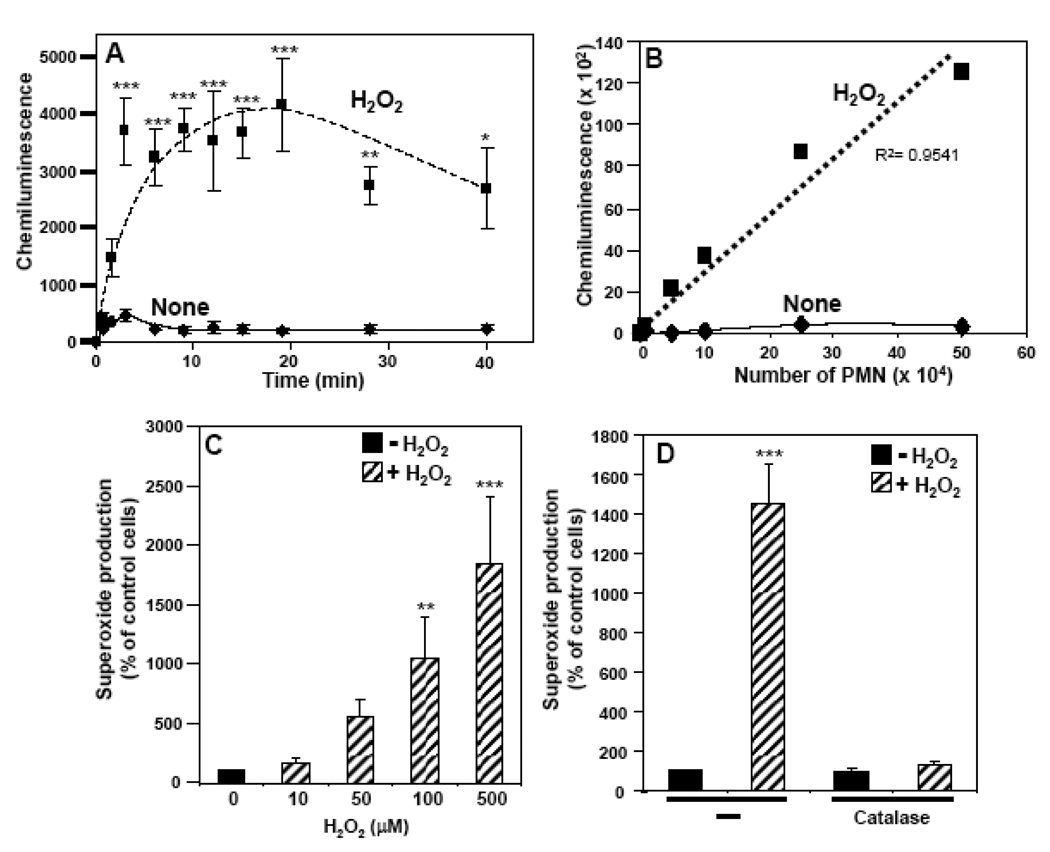
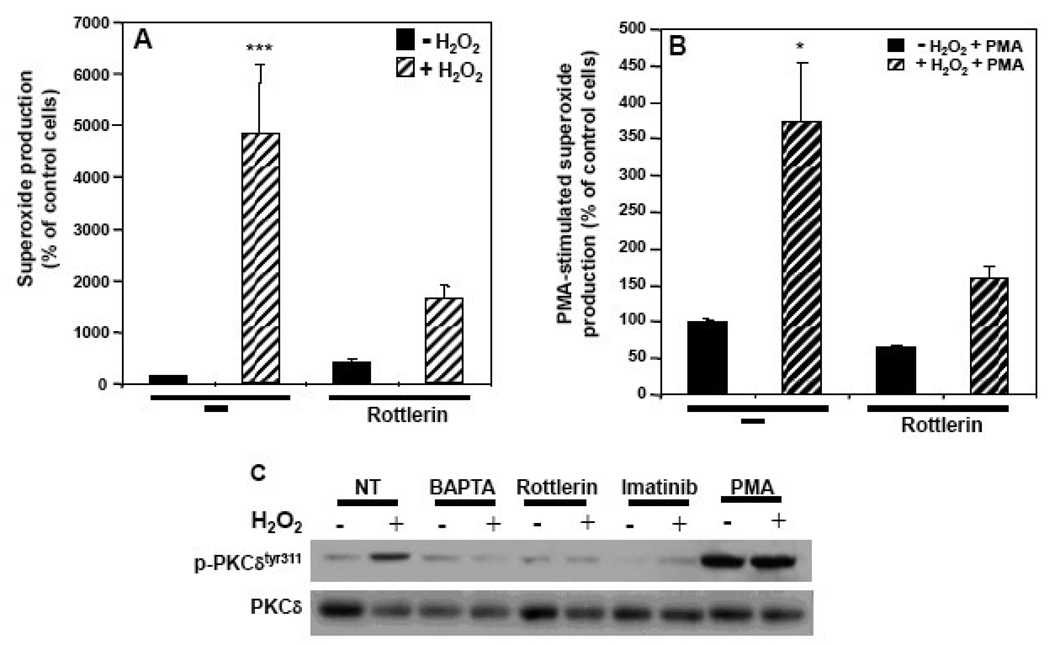
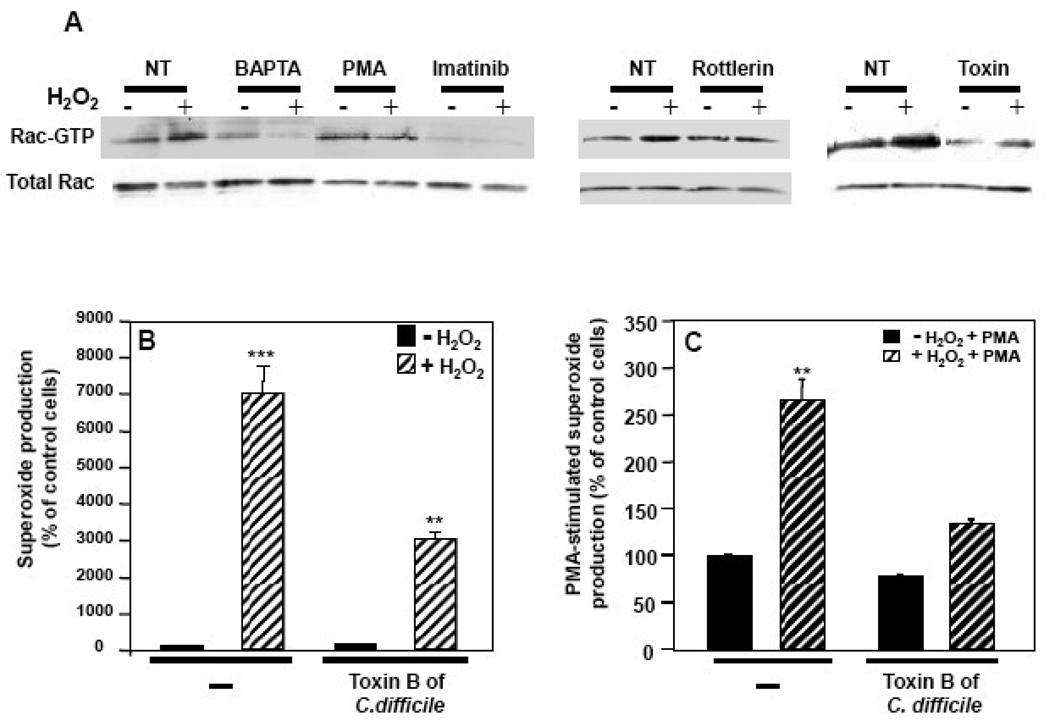
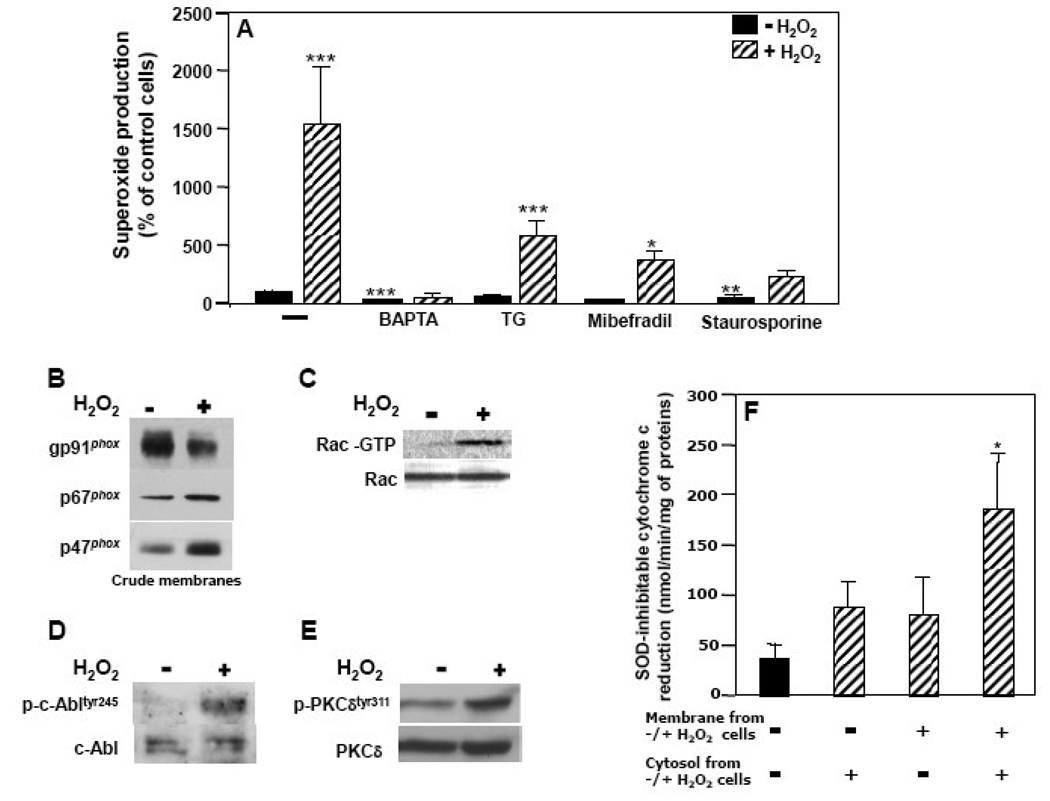
The importance of H(2)O(2) as a cellular signaling molecule has been demonstrated in a number of cell types and pathways. Here we explore a positive feedback mechanism of H(2)O(2)-mediated regulation of the phagocyte respiratory burst NADPH oxidase (NOX2). H(2)O(2) induced a dose-dependent stimulation of superoxide production in human neutrophils, as well as in K562 leukemia cells overexpressing NOX2 system components. Stimulation was abrogated by the addition of catalase, the extracellular Ca(2+) chelator BAPTA, the T-type Ca(2+) channel inhibitor mibefradil, the PKCdelta inhibitor rottlerin, or the c-Abl nonreceptor tyrosine kinase inhibitor imatinib mesylate or by overexpression of a dominant-negative form of c-Abl. H(2)O(2) induced phosphorylation of tyrosine 311 on PKCdelta and this activating phosphorylation was blocked by treatment with rottlerin, imatinib mesylate, or BAPTA. Rac GTPase activation in response to H(2)O(2) was abrogated by BAPTA, imatinib mesylate, or rottlerin. In conclusion, H(2)O(2) stimulates NOX2-mediated superoxide generation in neutrophils and K562/NOX2 cells via a signaling pathway involving Ca(2+) influx and c-Abl tyrosine kinase acting upstream of PKCdelta. This positive feedback regulatory pathway has important implications for amplifying the innate immune response and contributing to oxidative stress in inflammatory disorders.


Figures

Fig. 1
Fig. 1. Effects of H2O2 on superoxide production by human neutrophils
Superoxide production by neutrophils was measured using a whole cell assay with the Diogenes reagent. (A) Chemiluminescence generated by 0.25×10⁶ neutrophils incubated with 100 µM H2O2 (broken line) or PBS-G (solid line) was measured for the indicated times. (B) Chemiluminescence generated by increasing numbers of neutrophils incubated with 100 µM H2O2 (broken line) or PBS-G (solid line) was measured over 10 min, and after subtraction of the zero-time values the area under the curve was calculated (arbitrary units) as the measure of total superoxide production. (C) Superoxide production was determined in neutrophils stimulated with increasing concentrations of H2O2 and after subtraction of the zero-time values the area under the curve was calculated and expressed as a percent of the control cells without H2O2. (D) Neutrophils, either non-treated (−) or pre-treated with catalase (900 U/ml), were stimulated with 100 µM H2O2 and superoxide production was measured and expressed as in Fig. 1C. (E) Neutrophils were incubated with increasing concentrations of glucose oxidase and 5 mM glucose, or with 100 µ M H2O2 and superoxide production was measured and expressed as in Fig. 1C. (G) Neutrophils were incubated with 25 mU/ml of glucose oxidase and 5 mM glucose in the presence or absence of catalase (900 U/ml), or with 100 µM H2O2 and superoxide production was measured for the indicated times. (G) Neutrophils were pre-incubated with or without 100 µM H2O2 for 10 min, then stimulated with PMA (1 µg/ml), and superoxide production was measured and expressed as in Fig. 1C. The data are the means +/− SEM of 3–6 independent experiments. Asterisks indicate statistical significance versus control cells without H2O2. *P<0.05, **P<0.01, ***P<0.001.
Fig. 2
Fig. 2. Effect of H2O2 on superoxide production by K562/NOX2 cells
K562 cells over-expressing NOX2 plus p47phox/p67phox or only p47phox/p67phox were assayed for superoxide production as described in Fig. 1. (A) Chemiluminescence output was measured from 0.5x10⁶ K562/NOX2 cells incubated with (broken line) or without (solid line) 100 µM H2O2 and from K562 cells expressing only p47phox and p67phox (dotted line) incubated with H2O2 for the indicated times. (B) Superoxide production by K562/NOX2 cells incubated with increasing concentrations of H2O2 (0–500 µM) was measured for 10 min and expressed as in Fig. 1C. (C) K562/NOX2 cells, either non-treated (−) or pre-treated with catalase (900 U/ml), were stimulated with 100 µM H2O2 and superoxide production was measured and expressed as in Fig. 1C. (D) K562/NOX2 cells were pre-incubated with or without 100 µM H2O2 for 10 min, then stimulated with PMA (1 µg/ml), and chemiluminescence was measured and expressed as in Fig. 1A. Chemiluminescence was also measured in K562 cells expressing only p47phox and p67phox pre-incubated with H2O2 and then stimulated by PMA (dotted line). (E) K562/NOX2 cells were pre-incubated with or without 100 µM H2O2 for 10 min, then stimulated with PMA (1 µg/ml), and superoxide production was measured and expressed as in Fig. 1C. The data shown are the mean +/− SEM of 3–9 independent experiments. Asterisks indicate statistical significance versus non-treated cells without H2O2. **P <0.01, ***P < 0.001.
Fig. 3
Fig. 3. Role of Ca2+ in H2O2-NOX2 regulation
(A, B) K562/NOX2 cells were pre-treated with the indicated inhibitors: BAPTA (50 µM, 5 min), thapsigargin (TG; 100 nM, 30 min), mibefradil (15 µM, 1h). The cells were then tested for superoxide production with (hatched bars) or without (solid bars) 100 µM H2O2 for 10 min (A) or after further stimulation with PMA (1 µg/ml) for an additional 10 min (B). Superoxide production was expressed as in Fig. 1C as a percent of control cells (−) in the absence of H2O2. The data shown are the means +/- SEM of 5–10 independent experiments. Asterisks indicate statistical significance versus non-treated cells without H2O2. *P < 0.05; ***P < 0.001. (C) Confocal microscopy of H2O2-induced superoxide generation and Ca2+ influx was performed using either K562 cells expressing NOX2, p67phox, and p47phox (right panels) or only p67phox and p47phox (left panels). The cells were loaded with fluo-4 (green fluorescence, Ca2+) and DHE (red fluorescence, superoxide) and stimulated with 100 µM H2O2. Confocal images using a Zeiss microscope were recorded for up to 10 min using dual excitation at 488/543 nm. Each set of four photomicrographic panels corresponds to superoxide (top left), Ca2+ (top right), the differential interference contrast image (bottom left), and a merge of the two fluorescence images (bottom right). The scale bar indicates 10 µm.
Fig. 4
Fig. 4. Role of c-Abl tyrosine kinase in H2O2-NOX2 regulation
Superoxide production was determined with (hatched bars) or without (solid bars) 100 µM H2O2 for 10 min (A, C), or after further stimulation with PMA (1 µg/ml) for an additional 10 min (B, D) using K562/NOX2 cells pre-treated or not (–) with imatinib mesylate (10 µM, overnight) (A, B) or using K562 cells over-expressing GFP-KD-c-Abl or GFP-WT-c-Abl and the NOX2 system (C, D). Superoxide production was expressed as in Fig. 1C as a percent of control cells without H2O2 (A, B) or versus K562/NOX2 cells without H2O2 (C, D). The data shown are the means +/− SEM of 3–4 independent experiments. Asterisks indicate statistical significance versus nontreated cells without H2O2 (A, B) or versus K562/NOX2 cells without H2O2 (C, D). *P < 0.05; ***P < 0.001.
Fig. 5
Fig. 5. Role of PKCδ in H2O2-NOX2 regulation downstream of Ca2+ and c-Abl
(A, B) K562/NOX2 cells were pre-treated with rottlerin 20 µM for 3h, then tested for superoxide production with (hatched bars) or without (solid bars) 100 µM H2O2 for 10 min (A) or after further stimulation with PMA (1 µg/ml) for an additional 10 min (B). Superoxide production was expressed as in Fig. 1C as a percent of control cells in the absence of H2O2. The data shown are the means +/− SEM of 3–9 independent experiments. Asterisks indicate statistical significance versus non-treated cells without H2O2. *P < 0.05, ***P < 0.001. (C) A representative immunoblot experiment using antibodies against the phosphorylated tyrosine311-PKCδ and total PKCδ and cell lysates prepared from K562/NOX2 cells pre-treated with the indicated inhibitors [BAPTA (50 µM, 5 min), rottlerin (20 µM, 3 h), imatinib (10 µM, overnight)], or PMA (1 µg/ml, 5 min) and then stimulated (+) or not (−) with 100 µM H2O2 for 10 min.
Fig. 6
Fig. 6. Role of Rac activation in H2O2-NOX2 regulation
(A) Total cell lysates (100 µg of protein) were prepared from K562/NOX2 cells that had been pre-treated with the indicated inhibitors [BAPTA (50 µM, 5 min), imatinib (10 µM, overnight), rottlerin (20 µM, 3 h), C. difficile toxin B (1 nM, overnight)], or PMA (1 µg/ml, 5 min) and then stimulated (+) or not (−) with 100 µM H2O2 for 10 min. The levels of active Rac (Rac-GTP) were determined using the GST-PAK-CRIB pull-down assay. (B, C) K562/NOX2 cells were pre-treated with toxin B of C. difficile, 1 nM overnight, then tested for superoxide production with (hatched bars) or without (solid bars) 100 µM H2O2 for 10 min (B) or after further stimulation with PMA (1 µg/ml) for an additional 10 min (C). Superoxide production was expressed as in Fig. 1C as a percent of control cells without H2O2. Data shown are the mean +/− SEM of three independent experiments. Asterisks indicate statistical significance versus non-treated cells without H2O2. ** P <0.01, ***P < 0.001.
Fig. 7
Fig. 7. Assessment of H2O2-NOX2 signaling pathways in neutrophils
(A) Neutrophils were pre-treated with the indicated inhibitors: BAPTA (50 µM, 5 min), thapsigargin (TG; 100 nM, 30 min), mibefradil (15 µM, 1 h), staurosporine (1 µM, 30 min). The cells were then tested for superoxide production with (hatched bars) or without (solid bars) 100 µM H2O2 for 10 min. Superoxide production was expressed as in Fig. 1C as a percent of control cells without H2O2. Data shown are the mean +/− SEM of 3-7 independent experiments. Asterisks indicate statistical significance versus control cells without H2O2. * P <0.05, ** P <0.01, ***P < 0.001. (B) NOX2 assembly was assessed by immunoblot analysis of membrane preparations from neutrophils stimulated (+) or not (−) with 100 µM H2O2 using antibodies directed against NOX2, p47phox, or p67phox. (C) Total cell lysates (100 µg of protein) were prepared from neutrophils that had been stimulated (+) or not (−) with 100 µM H2O2. The levels of total Rac and active Rac were determined as in Fig 6A. (D, E) Activated (phosphorylated) c-Abl and PKCδ were assessed by immunoblot analysis with general and phosphospecific antibodies to c-Abl-Tyr245 (D) and PKCδTyr311 (E), respectively, on whole cell lysates from neutrophils stimulated (+) or not (−) with 100 µM H2O2. (F) Reconstitution of NADPH oxidase activity in the broken cell system was performed as described in experimental procedures using membrane and cytosol fractions from neutrophils pre-treated (+) or not (−) with 100 µM H2O2 for 10 min. Superoxide production was measured as SOD-inhibitable cytochrome c reduction and expressed in nmol/min/mg of protein. Data shown are the mean +/− SEM of 3 independent experiments. Asterisks indicate statistical significance versus superoxide produced by the combination of membranes and cytosol isolated from untreated neutrophils. * P <0.05.
Fig. 8
Fig. 8. Effect of H2O2 on fMLF-stimulated superoxide production
(A) Neutrophils were pre-treated with various amounts of H2O2 and then stimulated with 100 nM fMLF. (B) Neutrophils were pre-treated with 10 µg/ml PTX for 1 h and then tested for superoxide production with (hatched bars) or without (solid bars) 100 µM H2O2 for 10 min. In A and B superoxide production was measured and expressed as in Fig. 1C as a percent of control cells without H2O2. Data shown are the mean +/− SEM of three independent experiments. Asterisks indicate statistical significance versus non-treated cells without H2O2. * P <0.05, ** P <0.01, ***P < 0.001. (C) The schema represents a model for H2O2-NOX2 regulatory pathways.

Similar articles

Cited by

References

    1. Lambeth JD, Kawahara T, Diebold B. Regulation of Nox and Duox enzymatic activity and expression. Free Radical Biology and Medicine. 2007;43:319–331. - PMC - PubMed
    1. Bedard K, Krause K-H. The NOX Family of ROS-Generating NADPH Oxidases: Physiology and Pathophysiology. Physiol. Rev. 2007;87:245–313. - PubMed
    1. Han CH, Freeman JL, Lee T, Motalebi SA, Lambeth JD. Regulation of the neutrophil respiratory burst oxidase. Identification of an activation domain in p67(phox) J. Biol. Chem. 1998;273:16663–16668. - PubMed
    1. Bokoch GM, Ulla GK. NADPH oxidases: not just for leukocytes anymore! Trends Biochem. Sci. 2003;28:502–508. - PubMed
    1. El Jamali A, Valente AJ, Lechleiter JD, Gamez M, W PD, Nauseef MW, Clark R. A. Novel redox-dependent regulation of NOX5 by the tyrosine kinase c-Abl. Free Radic. Biol. Med. 2008;44:868–881. - PMC - PubMed

Publication types

MeSH terms

LinkOut - more resources