. 2010 Apr;38(6):1874-88.
doi: 10.1093/nar/gkp1153. Epub 2009 Dec 30.

RepD-mediated recruitment of PcrA helicase at the Staphylococcus aureus pC221 plasmid replication origin, oriD

Affiliations

RepD-mediated recruitment of PcrA helicase at the Staphylococcus aureus pC221 plasmid replication origin, oriD

C Machón et al. Nucleic Acids Res. 2010 Apr.

Abstract

Plasmid encoded replication initiation (Rep) proteins recruit host helicases to plasmid replication origins. Previously, we showed that RepD recruits directionally the PcrA helicase to the pC221 oriD, remains associated with it, and increases its processivity during plasmid unwinding. Here we show that RepD forms a complex extending upstream and downstream of the core oriD. Binding of RepD causes remodelling of a region upstream from the core oriD forming a 'landing pad' for the PcrA. PcrA is recruited by this extended RepD-DNA complex via an interaction with RepD at this upstream site. PcrA appears to have weak affinity for this region even in the absence of RepD. Upon binding of ADPNP (non-hydrolysable analogue of ATP), by PcrA, a conformational rearrangement of the RepD-PcrA-ATP initiation complex confines it strictly within the boundaries of the core oriD. We conclude that RepD-mediated recruitment of PcrA at oriD is a three step process. First, an extended RepD-oriD complex includes a region upstream from the core oriD; second, the PcrA is recruited to this upstream region and thirdly upon ATP-binding PcrA relocates within the core oriD.


Figures

Figure 1.
Figure 1.
ExoIII footprinting of the oriD (−) strand. ExoIII footprinting was carried out in the presence of RepD (A), PcrA (B), RepD+PcrA (C) and RepD+PcrA+ADPNP/Mg2+ (D). The complete sequence of oriD containing DNA used in these experiments is shown in (E) with the ICR I, ICR II and ICR III sites marked by converging arrows. The asterisk at the 5′-end of the (−) strand (bottom strand) indicates the radioactive phosphate. The 3′–5′ direction of the ExoIII digestion is indicated by an arrow starting at the 3′-end of the (−) strand. For clarity, the ExoIII resistance points have been marked by white (RepD) and black (PcrA) boxes along the sequence of the probe and by labelled arrows next to the sequence ladder. The precise position of oriD in the sequence ladder is indicated by a vertical black bar and the position where RepD nicks the DNA within oriD is also indicated. The gel in (A) shows ExoIII digestions of the radioactively labelled probe for 5 and 10 min in the presence of 0.1 and 0.2 µM RepD. Only the lanes with controls are numbered at the bottom of the gel representing undigested probe in the absence of proteins (lane 1), undigested probe incubated with 0.2 µM RepD (lane 2) and probe in the absence of proteins digested with ExoIII for 5 and 10 min (lanes 3). The gel in (B) shows ExoIII digestions of probe for 5 and 10 min in the presence of 0.2, 0.5 and 1.0 µM PcrA. Only the lanes with controls are numbered at the bottom of the gel representing undigested probe in the absence of proteins (lane 1), undigested probe incubated with 1.0 µM PcrA (lane 2) and probe in the absence of proteins digested with ExoIII for 5 and 10 min (lanes 3). The gel in (C) shows ExoIII digestions of probe for 5 and 10 min in the presence of constant 0.2 µM RepD with 0.2, 0.5 and 1.0 µM PcrA. Only lanes with controls are numbered at the bottom of the gel representing probe incubated with 0.2 µM RepD and digested with ExoIII for 5 and 10 min (lanes 1), probe incubated with 1.0 µM PcrA and digested with ExoIII for 5 and 10 min (lanes 2), probe digested with ExoIII in the absence of proteins for 5 and 10 min (lane 3), undigested probe in the absence of proteins (lane 4), undigested probe incubated with 0.2 µM RepD (lane 5), undigested probe incubated with 1.0 µM PcrA (lane 6) and undigested probe incubated with 0.2 µM RepD and 1.0 µM PcrA (lane 7). The point of strong resistance to ExoIII digestion is marked by an asterisk. The gel in (D) shows ExoIII digestions of probe for 5 and 10 min in the presence of constant 0.2 µM RepD, 50 µM ADPNP, 200 µM MgCl2, with 0.2, 0.5 and 1.0 µM PcrA. Only lanes with controls are numbered at the bottom of the gel representing probe digested with ExoIII in the absence of proteins for 5 and 10 min (lanes 1) and probe incubated with 0.2 µM RepD and 1.0 µM PcrA digested with ExoIII for 5 and 10 min (lanes 2). The asterisk indicates the strong resistance to ExoIII digestion in the presence of RepD and PcrA.
Figure 2.
Figure 2.
ExoIII footprinting of the oriD (+) strand. ExoIII footprinting was carried out in the presence of RepD (A), PcrA (B), RepD+PcrA (C) and RepD+PcrA+ADPNP/Mg2+ (D). The complete sequence of oriD containing DNA used in these experiments is shown in (E) with the ICR I, ICR II and ICR III sites marked by converging arrows. The asterisk at the 5′-end of the (+) strand (top strand) indicates the radioactive phosphate and the 3′–5′ direction of the ExoIII digestion is indicated by an arrow starting at the 3′-end of the (+) strand. For clarity the ExoIII resistance points with RepD have been marked by white boxes, and with PcrA with black boxes along the sequence of the probe and by labelled arrows next to the sequence ladder. The resistance point detected in the absence of any proteins is shown in the middle of ICR I by a vertical arrow. The precise position of oriD in the sequence ladder is indicated by a vertical black bar and the position where RepD nicks the DNA within the oriD is also indicated. The gel in (A) shows ExoIII digestions of the radioactively labelled probe for 5, 10 and 15 min in the presence of 0.1 and 0.2 µM RepD. Controls represent undigested probe in the absence of proteins (lane 1), undigested probe incubated with 0.2 µM RepD (lane 2) and probe in the absence of proteins digested with ExoIII for 5, 10 and 15 min (lanes 3). The gel in (B) shows ExoIII digestions of probe for 5, 10 and 15 min in the presence of 0.2, 0.5 and 1.0 µM PcrA. Controls represent undigested probe in the absence of proteins (lane 1), undigested probe incubated with 1.0 µM PcrA (lane 2) and probe in the absence of proteins digested with ExoIII for 5, 10 and 15 min (lanes 3). The ExoIII resistance point that coincides with the resistance point detected at the front of oriD in the equivalent experiment in Figure 1B is marked by an asterisk. The gel in (C) shows ExoIII digestions of probe for 5, 10 and 15 min in the presence of constant 0.2 µM RepD with 0.2, 0.5 and 1.0 µM PcrA. Controls represent probe digested with ExoIII for 5, 10 and 15 min in the absence of proteins (lanes 1), probe incubated with 0.1 µM RepD and digested with ExoIII for 5, 10 and 15 min (lanes 2), probe incubated with 0.2 µM RepD and digested with ExoIII for 5, 10 and 15 min (lanes 3), undigested probe incubated with 0.2 µM RepD (lane 4), and undigested probe incubated with 1.0 µM PcrA (lane 5). The strong ExoIII resistance point at the end of ICR III is marked by an asterisk. The gel in (D) shows ExoIII digestions of probe for 5, 10 and 15 min in the presence of constant 0.2 µM RepD, 50 µM ADPNP, 200 µM MgCl2, with 0.2, 0.5 and 1.0 µM PcrA. Controls represent probe digested with ExoIII in the absence of proteins for 5, 10 and 15 min (lanes 1) and probe incubated with 0.2 µM RepD digested with ExoIII for 5, 10 and 15 min (lanes 2).
Figure 3.
Figure 3.
DNaseI footprinting of the (−) strand. The gel in (A) shows DNaseI footprinting in the presence of RepD only. The DNA sequence of the complementary (+) strand is shown and the position of the nick within the oriD is indicated by an arrow. Primer extension reactions were carried out with radioactively labelled oriD(r)NdeI oligonucleotide using plasmid pCERoriD incubated with increasing concentrations of RepD (5, 10, 50, 80, 100, 150, 200, 500, 1000 and 2000 nM) and digested with DNaseI. Controls represent primer extension reactions with undigested pCERoriD in the absence of RepD (lane 1), undigested pCERoriD in the presence of 500 nM RepD (lane 2) and digested pCERoriD in the absence of RepD (lane 3). The RepD footprint is indicated by a bar for clarity. The gel in (B) shows DNAaseI footprinting in the presence of RepD and PcrA. The DNA sequence of the complementary (+) strand is shown for clarity. Primer extension reactions were carried out with radioactively labelled oriD(r)NdeI oligonucleotide using plasmid pCERoriD incubated with 80 nM RepD and increasing concentrations of PcrA (10, 50, 80, 100, 150, 200, 500, 1000, 2000, 4000 and 8000 nM). Controls represent primer extension reactions with undigested pCERoriD (lane 1), undigested pCERoriD in the presence of 80 nM RepD (lane 2), undigested pCERoriD in the presence of 80 nM RepD and 8000 nM PcrA (lane 3), digested pCERoriD in the presence of 80 nM RepD (lane 4) and digested pCERoriD in the absence of proteins (lane 5).
Figure 4.
Figure 4.
DNaseI footprinting of the (+) strand (nicked strand). (A) DNAaseI footprinting in the presence of increasing amounts of RepD only. The DNA sequence of the complementary (−) strand is shown and the position of the nick within the oriD is indicated. Primer extension reactions were carried out with radioactively labelled oriD(d)NcoI oligonucleotide using plasmid pCERoriD incubated with increasing concentrations of RepD (50, 100, 150, 200, 500 and 1000 nM) and digested with DNaseI. Controls in lanes 1 represent primer extension reactions with digested pCERoriD in the absence of RepD. (B) Primer extension reactions from pCERoriD digested in the presence of 800 nM RepD and increasing concentrations of PcrA (50, 100, 200, 500, 1000, 2000 nM). (C) Primer extension reactions carried out in the presence of 100 nM R189K, 50 µM ADPNP, 200 µM MgCl2 and increasing concentrations of PcrA (50, 100, 200, 500, 1000 and 2000 nM). Controls in lane 1 represent primer extension reactions from pCERoriD digested in the absence of any proteins, in lane 2 reactions from pCERoriD digested in the presence of 100 nM R189K in the absence of ADPNP and MgCl2, in lane 3 reactions from pCERoriD digested in the presence of 100 nM R189K, 500 nM PcrA in the absence of ADPNP and MgCl2. (D) Primer extension reactions carried out using pCERoriD digested in the presence of 100 nM RepD, 50 µM ADPNP, 200 µM MgCl2 and increasing concentrations of PcrA (50, 100, 200, 500, 1000 and 2000 nM). Controls in lane 1 represent primer extension reactions from pCERoriD digested in the absence of any protein, in lane 2 reactions from pCERoriD digested in the presence of 100 nM RepD in the absence of ADPNP and MgCl2, in lane 3 reactions from pCERoriD digested in the presence of 100 nM RepD, 500 nM PcrA in the absence of ADPNP and MgCl2. (E) Magnification of the footprint detected in the presence of PcrA, with or without ADPNP, from the R189K + PcrA experiments is shown and the differences between minus and plus PcrA are marked by asterisks for clarity. (F) The complete sequence of the oriD containing probe used in these experiments is shown at the bottom of the figure with the ICR I, ICR II and ICR III sites marked by converging arrows. The precise positions of the DNaseI footprints in the sequence are indicated by horizontal white bars. The same footprints are also indicated by vertical white bars next to the gels for clarity. The black bar indicates the precise position of the DNaseI hypersensitive site observed in the presence of RepD. The position where RepD nicks the DNA within the oriD is indicated in the sequence of the far left gel.
Figure 5.
Figure 5.
The effects of nucleotides on the oriD–RepD–PcrA complex. (A) Detection of the ternary oriD–RepD–PcrA complex by gel shift assays. The gel on the left shows binding of RepD (0.01, 0.05, 0.08, 0.1, 0.2, 0.5, 1, 2, 4 and 5 µM) to a radioactively labelled linear DNA fragment (0.1 nM) containing the oriD. Binding reactions were carried out in 50 mM Tris–HCl pH 7.5, 200 mM KCl, 0.1 µg/µl polydIdC at 30°C for 15 min. Control C shows the radioactive probe in the absence of RepD. The gel on the right shows binding of PcrA (0.01, 0.05, 0.08, 0.1, 0.2, 0.5, 1, 2, 4, 5, 8 and 10 µM) in the presence of 0.5 µM RepD. Experimental conditions were as described in (A). Control C shows the radioactive probe in the absence of proteins and the lane next to C shows binding of RepD (0.5 µM) in the absence of PcrA. (B) The effect of ADPNP and ADP on oriD–RepD–PcrA ternary complex. The gel shows binding of PcrA (0.05, 0.1, 0.5, 1, 5 and 10 µM) in the presence of 0.5 µM RepD, 2 mM nucleotides (ADP and ADPNP) and 5 mM MgCl2. Control C shows the radioactive probe in the absence of proteins and the lane next to C shows binding of RepD (0.5 µM) in the absence of PcrA. (C) Gel shift assays using 0.1 nM of the 280 bp oriD containing probe with increasing concentrations of PcrA (0.01, 0.05, 0.08, 0.1, 0.2, 0.5, 1, 2, 4 and 5 µM) in the presence (left gel) of 0.1 µg/µl of polydIdC and PcrA (0.01, 0.05, 0.1, 0.2, 0.4, 0.6, 0.8, 1, 2 and 5 µM) in the absence of polydIdC (right gel). Binding reactions were carried out in 50 mM Tris–HCl pH 7.5, 200 mM KCl at 30°C for 15 min. Lane C shows the probe in the absence of PcrA.
Figure 6.
Figure 6.
Sedimentation analysis of the initiation complexes. (A) Fluorescein labelled oriD-DNA (5 nM) was incubated with increasing concentrations of RepD (0, 0.02, 0.04, 0.06, 0.2, 0.4, 0.6, 1, 1.2, 1.844, 3.688 and 7.375 µM) and the complexes were subjected to sedimentation AUC analysis as described in ‘Materials and Methods’ section. Plots of the sedimentation coefficient(s) versus RepD concentration are shown for the entire RepD titration (left graph) and the first phase 0–1.2 µM RepD (right graph). The latter was fitted to a one site binding hyperbola. (B) The DNA substrate was incubated initially with 600 nM RepD and then increasing concentrations of PcrA were added (0, 0.05, 0.1, 0.2, 0.3, 0.5, 1.03, 1.5, 2.062, 4.125, 6.187 and 8.25 µM). Plots of the sedimentation coefficient(s) versus PcrA concentration are shown for the entire PcrA titration (left graph) and the initial range 0–2.062 µM PcrA (right graph). (C) The same experiment as in panel B was carried out in the absence of RepD. Plots of the sedimentation coefficient(s) versus PcrA concentration are shown for the entire PcrA titration (left graph) and the first phase 0–0.5 µM PcrA (right graph). The latter was fitted to a one site binding hyperbola.
Figure 7.
Figure 7.
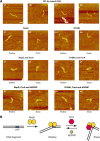
AFM images of complexes. (A) Tapping mode AFM images in air of the 353 bp DNA fragment containing the core oriD deposited on mica (a1–a4). Where indicated, RepD, R189K, PcrA and ADPNP are also present (b1–b4, c1–c4, d1–d4). The resultant DNA–protein complexes are divided into two categories depending on the angle induced by the bound protein: sharp and shallow. Representative software zoomed images at 300 × 300 nm are shown. The number of complexes observed and measured is given in the text. Scale bar is 50 nm. (B) Schematic interpretation of AFM data (not to scale) for RepD or R189K binding to oriD and subsequent recruitment of PcrA and ADPNP. The location of oriD is asymmetric in the 353 bp DNA fragment; the population of molecules exhibiting sharp angles is favoured upon addition of PcrA, although subsequent remodelling upon addition of ADPNP favours the shallow angles.
Figure 8.
Figure 8.
Distribution of bend angles. The angle between the DNA arms at the globular feature of each AFM image was measured for 100 images of each combination of Rep protein, PcrA and ADPNP as indicated. Molecules were classified into bend angle ranges and counted; the frequency of each bend angle range is shown.
Figure 9.
Figure 9.
RepD-mediated PcrA recruitment at oriD. A speculative schematic model to summarize the combined footprint data and explain the molecular events associated with RepD-mediated recruitment of PcrA at oriD. The top panel shows an open-loose RepD-oriD complex that protects the DNA from ExoIII digestion upstream and downstream from oriD. The precise architecture of this complex is not known. The apparent stoichiometries are based upon our combined footprinting and AUC data but should be considered with caution. At high ExoIII concentrations and prolonged digestions of the (−) strand, ExoIII can pass through ICR I but stops in the first half of ICR II. In the opposite direction on the (+) strand, at high concentrations and prolonged digestions the ExoIII can pass with difficulty through ICR III into ICR II and then into ICR I where it stops. The middle panel shows that PcrA is recruited upstream of the ICR I site and the PcrA–RepD–oriD ternary complex contracts into a closed more compact conformation. Even at high concentrations and prolonged digestions, ExoIII cannot pass through the upstream PcrA-recruitment site on the (−) strand. It also fails to pass through the ICR III site in the opposite direction on the (+) strand. The bottom panel shows the ADPNP-induced rearrangement of the ternary complex. As a consequence of ADPNP (non-hydrolysable analogue of ATP)-binding to PcrA the complex rearranges further with ExoIII on the (−) strand easily passing through the PcrA upstream recruitment site and through the ICR I site to stop within the first half of ICR II. From the opposite direction on the (+) strand, ExoIII can now pass through the ICR III and ICR II sites but stops at the ICR I site. These rearrangements are consistent with an ATP-induced movement of PcrA from the RepD dimer bound to ICR I to the RepD dimer bound to ICR II to set up a translocation competent RepD–PcrA complex.

Similar articles

Cited by

References

    1. Gillespie MT, Skurray RA. Structural relationships among chloramphenicol-resistance plasmids of Staphylococcus aureus. FEMS Microbiol. Lett. 1988;51:205–210.
    1. Daini OA, Akano SA. Plasmid-mediated antibiotic resistance in Staphylococcus aureus from patients and non-patients. Sci. Res. Essay. 2009;4:346–350.
    1. Del Solar G, Giraldo R, Ruiz-Echevarria MJ, Espinosa M, Diaz-Orejas R. Replication and control of circular bacterial plasmids. Microbiol. Mol. Biol. Rev. 1998;62:434–464. - PMC - PubMed
    1. Khan SA. Plasmid rolling-circle replication: recent developments. Mol. Microbiol. 2000;37:477–484. - PubMed
    1. Novick RP. Staphylococcal plasmids and their replication. Ann. Rev. Microbiol. 1989;43:537–565. - PubMed

Publication types