

A novel approach to analyze gene expression data demonstrates that the DeltaF508 mutation in CFTR downregulates the antigen presentation pathway
- PMID: 20044437
- PMCID: PMC2853347
- DOI: 10.1152/ajplung.00379.2009
A novel approach to analyze gene expression data demonstrates that the DeltaF508 mutation in CFTR downregulates the antigen presentation pathway
Abstract
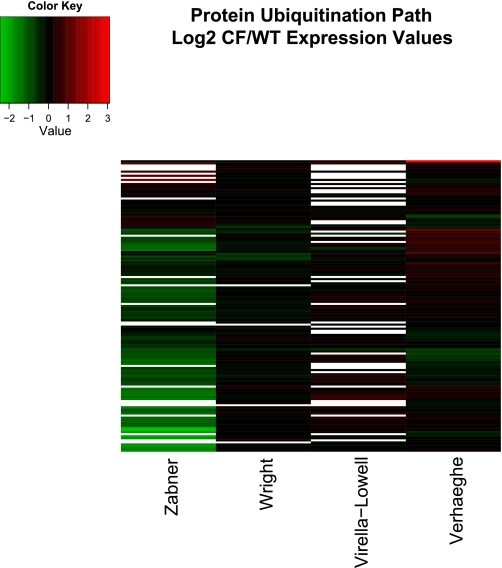
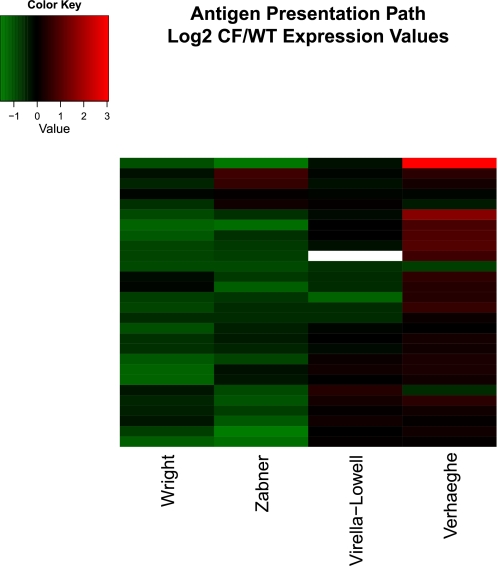
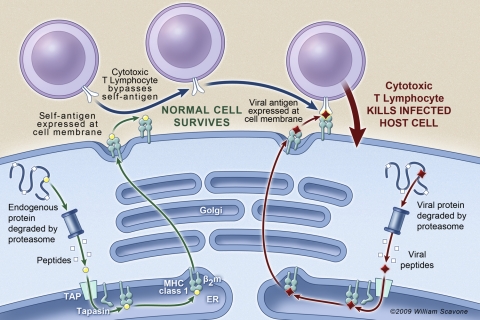
Gene array studies comparing cystic fibrosis (CF) and non-CF genotypes should reveal factors that explain variability in CF lung disease progression, yielding insights that lead to improved CF care. To date, studies have reached conflicting conclusions, perhaps due to experimental differences and divergent statistical approaches. This review aims: 1) to summarize the findings of four recent gene studies comparing CF and non-CF genotypes, and 2) to reanalyze original data using a recently developed statistical approach, with the aim of identifying genes and paths consistently regulated by the CF genotype. We identified four studies evaluating the effect of the DeltaF508-CFTR mutation on human airway epithelial cell gene expression, restricting our investigation to human airway epithelial cell studies whose data were accessible in NCBI's Gene Expression Omnibus or the European Bioinformatic Institute's ArrayExpress. Gene expression patterns showed consistent repression of MHC class I antigen presentation genes in CF human airway epithelia, suggesting a novel mechanistic explanation for poor clearance of viral and bacterial infections by CF patients. We also examined proinflammatory and NF-kappaB genes, whose induction is widely accepted as a hallmark of the CF genotype, but found little evidence of induction, consistent with a recent review (Machen TE, Am J Physiol Cell Physiol 291: C218-C230, 2006.). In conclusion, our analysis suggests that the CF genotype may impair immune function in airway epithelial cells but may not increase inflammation. Additional studies are required to determine whether MHC class I gene repression in CF reduces antigen presentation at the protein level and whether repression impairs immune function.
Figures
Similar articles
-
CFTR DeltaF508 mutation has minimal effect on the gene expression profile of differentiated human airway epithelia.Am J Physiol Lung Cell Mol Physiol. 2005 Oct;289(4):L545-53. doi: 10.1152/ajplung.00065.2005. Epub 2005 Jun 3. Am J Physiol Lung Cell Mol Physiol. 2005. PMID: 15937068
-
Control of the proinflammatory state in cystic fibrosis lung epithelial cells by genes from the TNF-alphaR/NFkappaB pathway.Mol Med. 2001 Aug;7(8):523-34. Mol Med. 2001. PMID: 11591888 Free PMC article.
-
Regulation of cystic fibrosis transmembrane conductance regulator by microRNA-145, -223, and -494 is altered in ΔF508 cystic fibrosis airway epithelium.J Immunol. 2013 Apr 1;190(7):3354-62. doi: 10.4049/jimmunol.1202960. Epub 2013 Feb 22. J Immunol. 2013. PMID: 23436935
-
Can correcting the ΔF508-CFTR proteostasis-defect rescue CF lung disease?Curr Mol Med. 2012 Aug;12(7):860-71. doi: 10.2174/156652412801318773. Curr Mol Med. 2012. PMID: 22697346 Review.
-
Microarray analysis in cystic fibrosis.J Cyst Fibros. 2004 Aug;3 Suppl 2:29-33. doi: 10.1016/j.jcf.2004.05.006. J Cyst Fibros. 2004. PMID: 15463921 Review.
Cited by
-
Does the F508-CFTR mutation induce a proinflammatory response in human airway epithelial cells?Am J Physiol Lung Cell Mol Physiol. 2012 Sep 15;303(6):L509-18. doi: 10.1152/ajplung.00226.2011. Epub 2012 Jul 20. Am J Physiol Lung Cell Mol Physiol. 2012. PMID: 22821996 Free PMC article.
-
Regulation of the epithelial Na+ channel and airway surface liquid volume by serine proteases.Pflugers Arch. 2010 Jun;460(1):1-17. doi: 10.1007/s00424-010-0827-z. Epub 2010 Apr 18. Pflugers Arch. 2010. PMID: 20401730 Free PMC article. Review.
-
In silico search for modifier genes associated with pancreatic and liver disease in Cystic Fibrosis.PLoS One. 2017 Mar 24;12(3):e0173822. doi: 10.1371/journal.pone.0173822. eCollection 2017. PLoS One. 2017. PMID: 28339466 Free PMC article.
-
Effects of Pseudomonas aeruginosa on CFTR chloride secretion and the host immune response.Am J Physiol Cell Physiol. 2017 Apr 1;312(4):C357-C366. doi: 10.1152/ajpcell.00373.2016. Epub 2017 Jan 25. Am J Physiol Cell Physiol. 2017. PMID: 28122735 Free PMC article. Review.
-
Changes in transcriptome of native nasal epithelium expressing F508del-CFTR and intersecting data from comparable studies.Respir Res. 2013 Mar 28;14(1):38. doi: 10.1186/1465-9921-14-38. Respir Res. 2013. PMID: 23537407 Free PMC article.
References
-
- Ashburner M, Ball CA, Blake JA, Botstein D, Butler H, Cherry JM, Davis AP, Dolinski K, Dwight SS, Eppig JT, Harris MA, Hill DP, Issel-Tarver L, Kasarskis A, Lewis S, Matese JC, Richardson JE, Ringwald M, Rubin GM, Sherlock G. Gene ontology: tool for the unification of biology. The Gene Ontology Consortium. Nat Genet 25: 25–29, 2000 - PMC - PubMed
-
- Boucher RC. Evidence for airway surface dehydration as the initiating event in CF airway disease. J Intern Med 261: 5–16, 2007 - PubMed
-
- Breitling R. Biological microarray interpretation: the rules of engagement. Biochim Biophys Acta 1759: 319–327, 2006 - PubMed
Publication types
MeSH terms
Substances
Grants and funding
LinkOut - more resources
Full Text Sources
Research Materials