

Iodinated contrast opacification gradients in normal coronary arteries imaged with prospectively ECG-gated single heart beat 320-detector row computed tomography
- PMID: 20044512
- PMCID: PMC3063948
- DOI: 10.1161/CIRCIMAGING.109.854307
Iodinated contrast opacification gradients in normal coronary arteries imaged with prospectively ECG-gated single heart beat 320-detector row computed tomography
Abstract
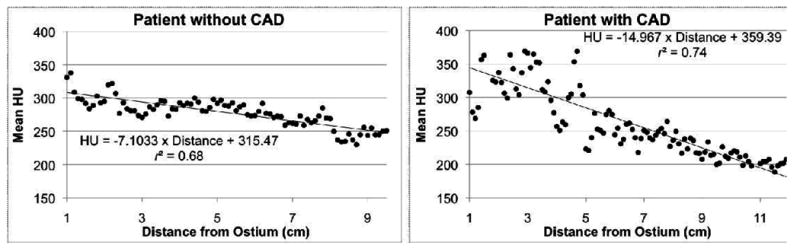
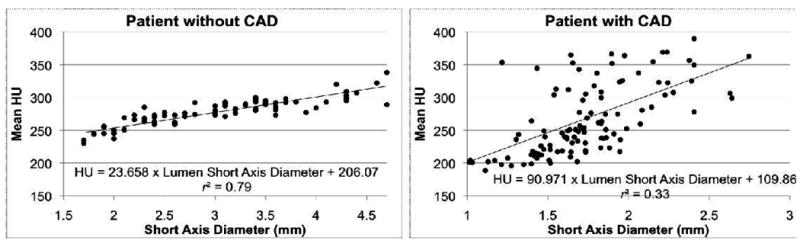
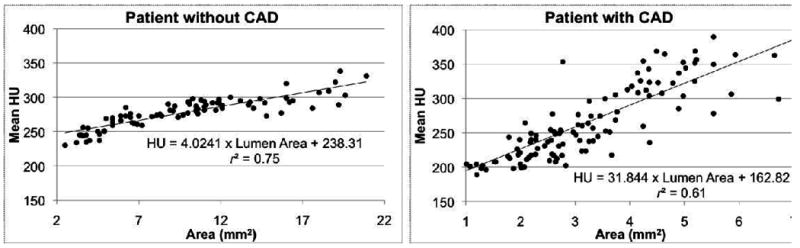
Background: To define and evaluate coronary contrast opacification gradients using prospectively ECG-gated single heart beat 320-detector row coronary angiography (CTA).
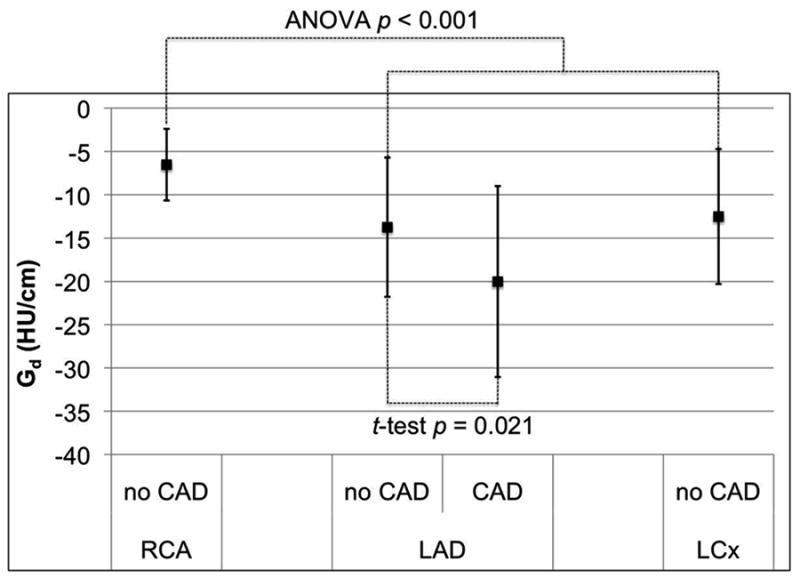
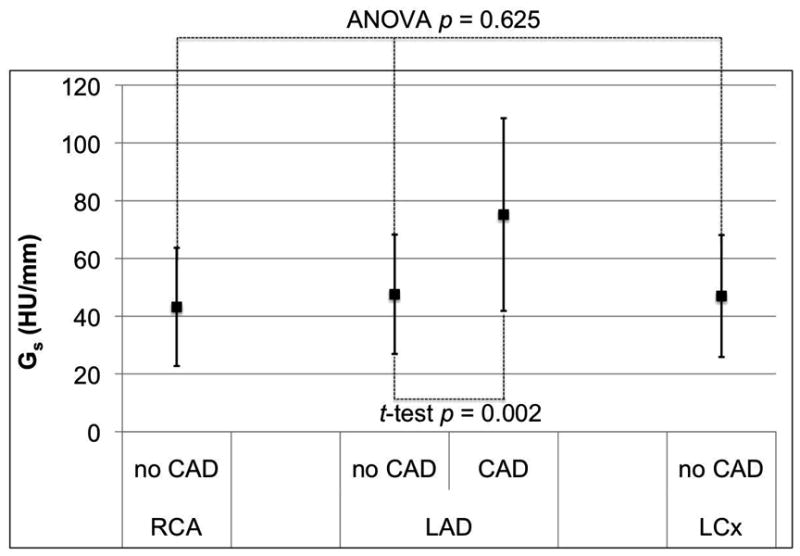
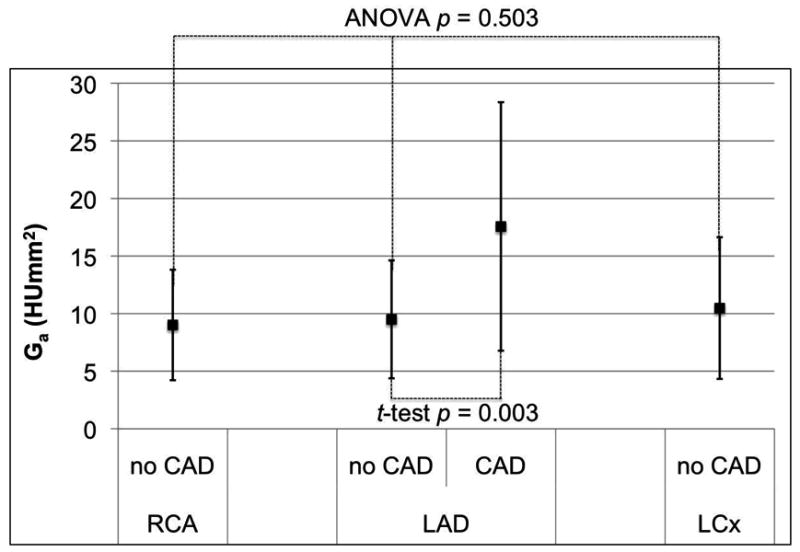
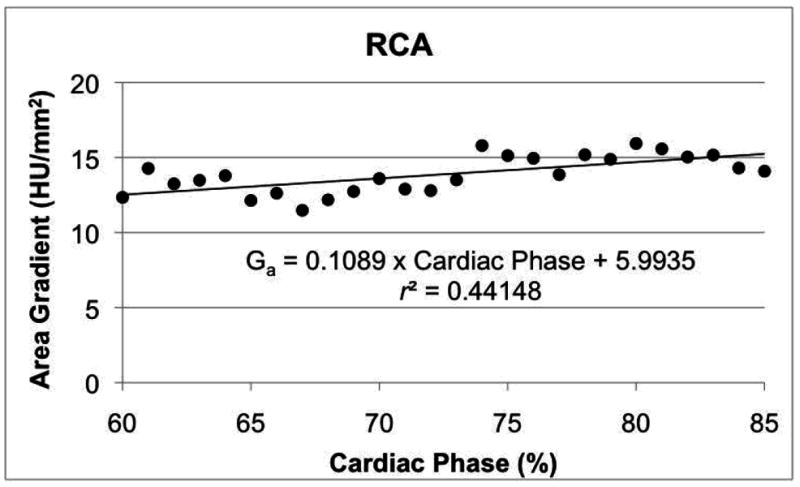
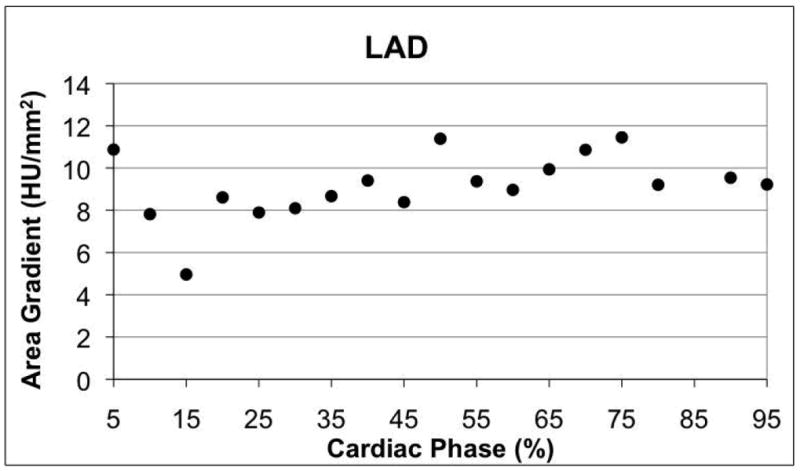
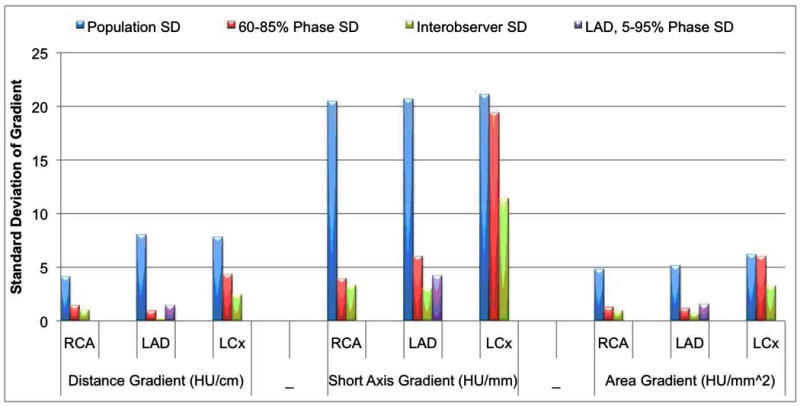
Methods and results: Thirty-six patients with normal coronary arteries determined by 320 x 0.5-mm detector row coronary CTA were retrospectively evaluated with customized image postprocessing software to measure Hounsfield Units at 1-mm intervals orthogonal to the artery center line. Linear regression determined correlation between mean Hounsfield Units and distance from the coronary ostium (regression slope defined as the distance gradient G(d)), lumen cross-sectional area (G(a)), and lumen short-axis diameter (G(s)). For each gradient, differences between the 3 coronary arteries were analyzed with ANOVA. Linear regression determined correlations between measured gradients, heart rate, body mass index, and cardiac phase. To determine feasibility in lesions, all 3 gradients were evaluated in 22 consecutive patients with left anterior descending artery lesions > or =50% stenosis. For all 3 coronary arteries in all patients, the gradients G(a) and G(s) were significantly different from zero (P<0.0001), highly linear (Pearson r values, 0.77 to 0.84), and had no significant difference between the left anterior descending, left circumflex, and right coronary arteries (P>0.503). The distance gradient G(d) demonstrated nonlinearities in a small number of vessels and was significantly smaller in the right coronary artery when compared with the left coronary system (P<0.001). Gradient variations between cardiac phases, heart rates, body mass index, and readers were low. Gradients in patients with lesions were significantly different (P<0.021) than in patients considered normal by CTA.
Conclusions: Measurement of contrast opacification gradients from temporally uniform coronary CTA demonstrates feasibility and reproducibility in patients with normal coronary arteries. For all patients, the gradients defined with respect to the coronary lumen cross-sectional area and short-axis diameters are highly linear, not significantly influenced by the coronary artery (left anterior descending artery versus left circumflex versus right coronary artery), and have only small variation with respect to patient parameters. Preliminary evaluation of gradients across coronary artery lesions is promising but requires additional study.
Conflict of interest statement
Figures
References
-
- Roberts WC, Jones AA. Quantitation of coronary arterial narrowing at necropsy in sudden coronary death: analysis of 31 patients and comparison with 25 control subjects. Am J Cardiol. 1979;44:39–45. - PubMed
-
- Marcus ML, Harrison DG, White CW, McPherson DD, Wilson RF, Kerber RE. Assessing the physiologic significance of coronary obstructions in patients: importance of diffuse undetected atherosclerosis. Prog Cardiovasc Dis. 1988;31:39–56. - PubMed
-
- Libby P. Molecular bases of the acute coronary syndromes. Circulation. 1995;91:2844–2850. - PubMed
-
- Falk E, Shah PK, Fuster V. Coronary plaque disruption. Circulation. 1995;92:657–671. - PubMed
-
- Farb A, Tang AL, Burke AP, Sessums L, Liang Y, Virmani R. Sudden coronary death. Frequency of active coronary lesions, inactive coronary lesions, and myocardial infarction. Circulation. 1995;92:1701–1709. - PubMed
