

Genome-wide association studies of MRI-defined brain infarcts: meta-analysis from the CHARGE Consortium
- PMID: 20044523
- PMCID: PMC2923092
- DOI: 10.1161/STROKEAHA.109.569194
Genome-wide association studies of MRI-defined brain infarcts: meta-analysis from the CHARGE Consortium
Abstract
Background and purpose: Previous studies examining genetic associations with MRI-defined brain infarct have yielded inconsistent findings. We investigated genetic variation underlying covert MRI infarct in persons without histories of transient ischemic attack or stroke. We performed meta-analysis of genome-wide association studies of white participants in 6 studies comprising the Cohorts for Heart and Aging Research in Genomic Epidemiology (CHARGE) consortium.
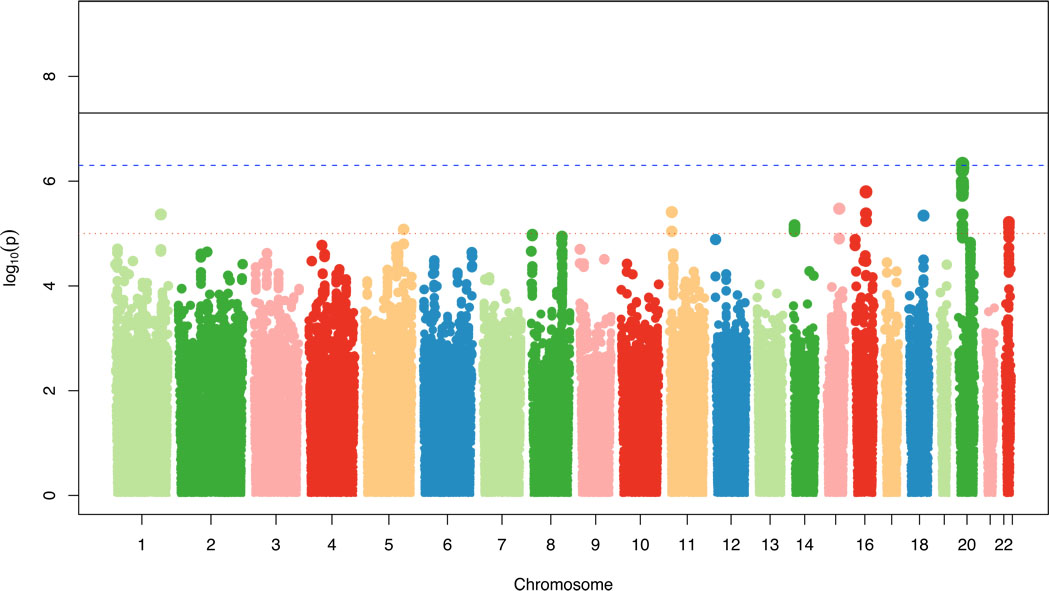
Methods: Using 2.2 million genotyped and imputed single nucleotide polymorphisms, each study performed cross-sectional genome-wide association analysis of MRI infarct using age- and sex-adjusted logistic regression models. Study-specific findings were combined in an inverse-variance-weighted meta-analysis, including 9401 participants with mean age 69.7 (19.4% of whom had >or=1 MRI infarct).
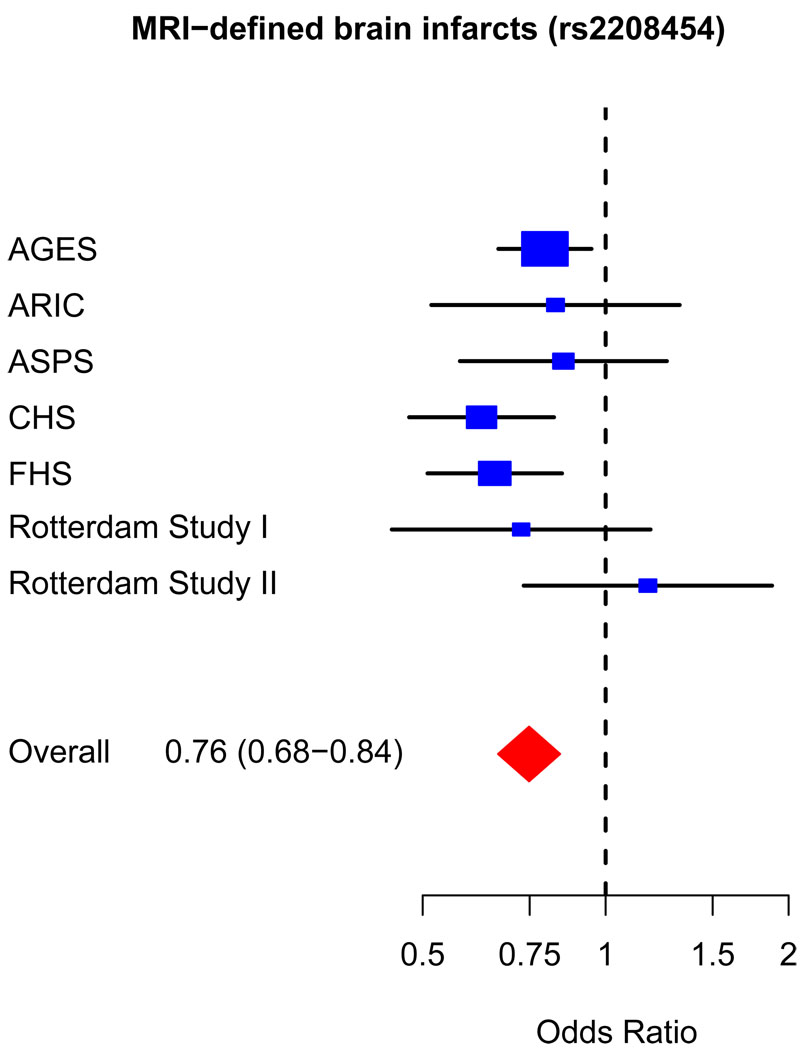
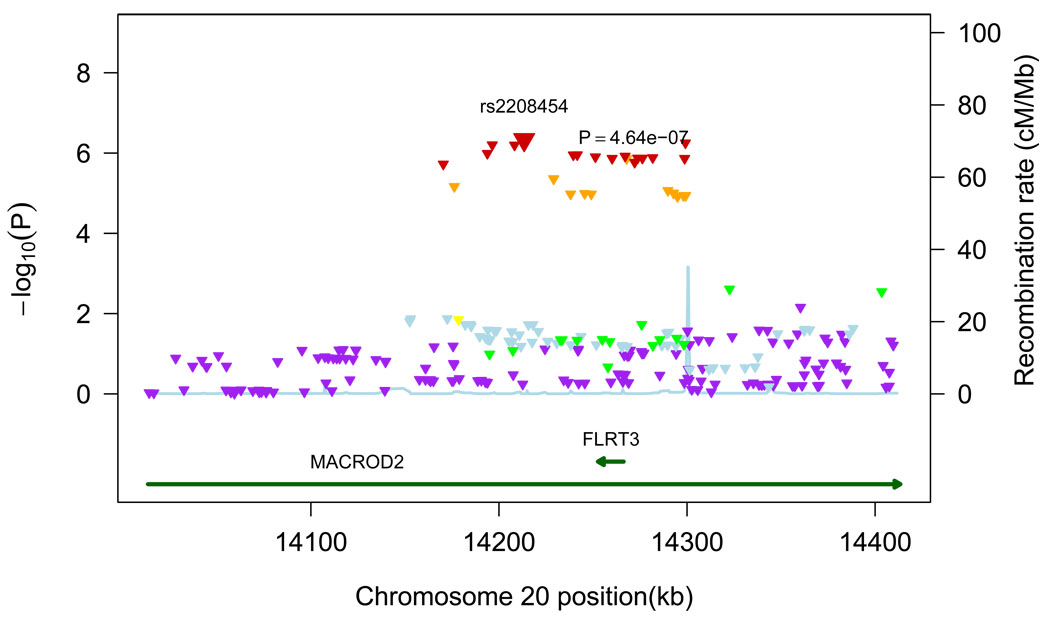
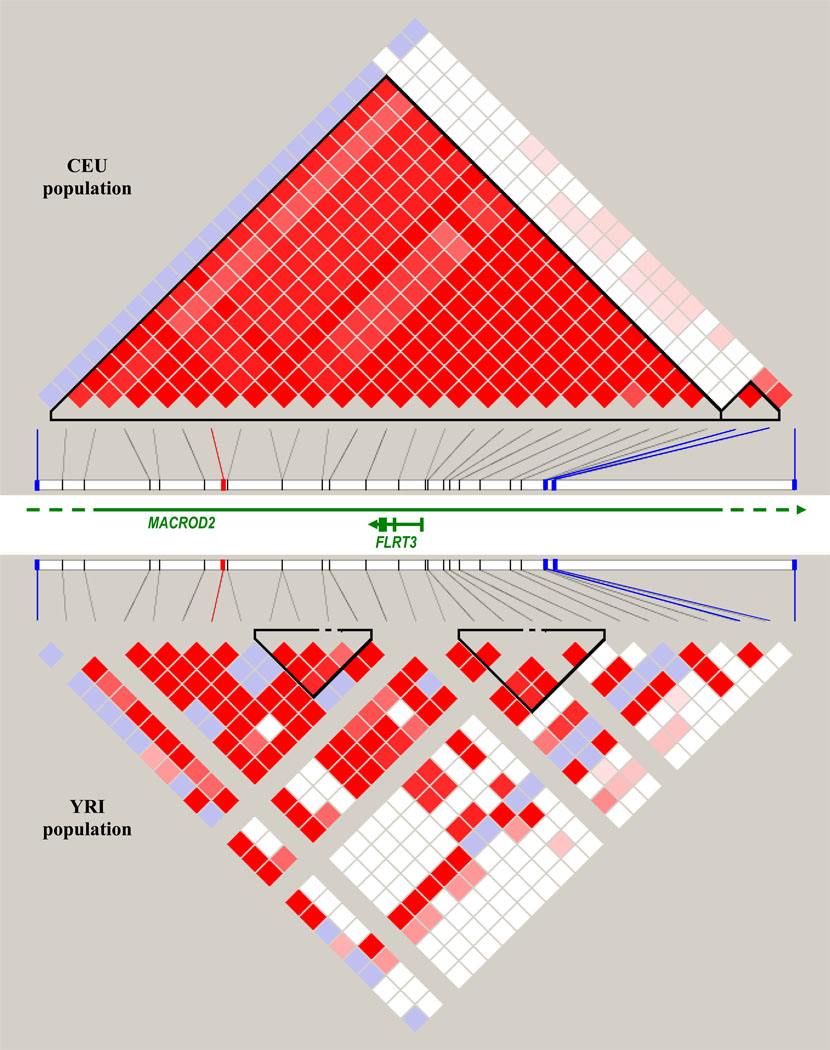
Results: The most significant association was found with rs2208454 (minor allele frequency, 20%), located in intron 3 of MACRO domain containing 2 gene and in the downstream region of fibronectin leucine-rich transmembrane protein 3 gene. Each copy of the minor allele was associated with lower risk of MRI infarcts (odds ratio, 0.76; 95% confidence interval, 0.68-0.84; P=4.64x10(-7)). Highly suggestive associations (P<1.0x10(-5)) were also found for 22 other single nucleotide polymorphisms in linkage disequilibrium (r(2)>0.64) with rs2208454. The association with rs2208454 did not replicate in independent samples of 1822 white and 644 black participants, although 4 single nucleotide polymorphisms within 200 kb from rs2208454 were associated with MRI infarcts in the black population sample.
Conclusions: This first community-based, genome-wide association study on covert MRI infarcts uncovered novel associations. Although replication of the association with top single nucleotide polymorphisms failed, possibly because of insufficient power, results in the black population sample are encouraging, and further efforts at replication are needed.
Keywords: MRI; brain infarction; cohort study; genome-wide association study; meta-analysis.
Conflict of interest statement
None.
Figures
References
-
- Longstreth WT., Jr Brain vascular disease overt and covert. Stroke. 2005;36:2062–2063. - PubMed
-
- Vermeer SE, Longstreth WT, Jr, Koudstaal PJ. Silent brain infarcts: a systematic review. Lancet Neurol. 2007;6:611–619. - PubMed
-
- Dichgans M. Genetics of ischaemic stroke. Lancet Neurol. 2007;6:149–161. - PubMed
-
- Morrison AC, Fornage M, Liao D, Boerwinkle E. Parental history of stroke predicts subclinical but not clinical stroke: the Atherosclerosis Risk in Communities Study. Stroke. 2000;31:2098–2102. - PubMed
-
- Leistner S, Huebner N, Faulstich A, Ludwig D, Rees M, Marx P, Langer B, Nikolova A, Hartmann A, Koennecke HC. Increased prevalence of microangiopathic brain lesions among siblings of patients with lacunar stroke. A prospective multicenter study. Eur Neurol. 2008;59:143–147. - PubMed
Publication types
MeSH terms
Substances
Grants and funding
- N01 HC055016/HL/NHLBI NIH HHS/United States
- R01 NS017950/NS/NINDS NIH HHS/United States
- R01 AG016495/AG/NIA NIH HHS/United States
- R01HL093029/HL/NHLBI NIH HHS/United States
- P 20545/FWF_/Austrian Science Fund FWF/Austria
- N01 HC055020/HL/NHLBI NIH HHS/United States
- N01-HC-55222/HC/NHLBI NIH HHS/United States
- R01 HL080295/HL/NHLBI NIH HHS/United States
- R01 AG020098/AG/NIA NIH HHS/United States
- DK063491/DK/NIDDK NIH HHS/United States
- UL1RR025005/RR/NCRR NIH HHS/United States
- RC2 HL102419/HL/NHLBI NIH HHS/United States
- N01 AG012100/AG/NIA NIH HHS/United States
- N01 HC055019/HL/NHLBI NIH HHS/United States
- UL1 RR025005/RR/NCRR NIH HHS/United States
- U01 HL080295/HL/NHLBI NIH HHS/United States
- N01-HC-55022/HC/NHLBI NIH HHS/United States
- N01 HC055021/HL/NHLBI NIH HHS/United States
- N01 HC085086/HL/NHLBI NIH HHS/United States
- N01-HC-55016/HC/NHLBI NIH HHS/United States
- N01 HC055018/HC/NHLBI NIH HHS/United States
- N01 HC025195/HC/NHLBI NIH HHS/United States
- N01 HC055015/HL/NHLBI NIH HHS/United States
- R01 HL087652/HL/NHLBI NIH HHS/United States
- U01 HG004402/HG/NHGRI NIH HHS/United States
- ZIA AG007380/ImNIH/Intramural NIH HHS/United States
- N01-HC-55021/HC/NHLBI NIH HHS/United States
- N01-HC-85086/HC/NHLBI NIH HHS/United States
- R01 HL093029/HL/NHLBI NIH HHS/United States
- P30 DK063491/DK/NIDDK NIH HHS/United States
- R01 AG008122/AG/NIA NIH HHS/United States
- N01-HC-55019/HC/NHLBI NIH HHS/United States
- M01RR00425/RR/NCRR NIH HHS/United States
- N01 HC025195/HL/NHLBI NIH HHS/United States
- R01 AG033193/AG/NIA NIH HHS/United States
- R01HL087641/HL/NHLBI NIH HHS/United States
- N01-HC-55015/HC/NHLBI NIH HHS/United States
- N01 HC055222/HL/NHLBI NIH HHS/United States
- N01 HC085079/HL/NHLBI NIH HHS/United States
- N01-HC-75150/HC/NHLBI NIH HHS/United States
- N01-HC-55020/HC/NHLBI NIH HHS/United States
- N01 HC055018/HL/NHLBI NIH HHS/United States
- M01 RR000425/RR/NCRR NIH HHS/United States
- N01-HC-85079/HC/NHLBI NIH HHS/United States
- N01 HC055022/HL/NHLBI NIH HHS/United States
- K23 AG038444/AG/NIA NIH HHS/United States
- P30 AG010129/AG/NIA NIH HHS/United States
- N01 HC075150/HL/NHLBI NIH HHS/United States
- N01-HC-55018/HC/NHLBI NIH HHS/United States
- R01 HL087641/HL/NHLBI NIH HHS/United States
LinkOut - more resources
Full Text Sources
