

Differential gene regulation by the human and mouse aryl hydrocarbon receptor
- PMID: 20044593
- PMCID: PMC2840214
- DOI: 10.1093/toxsci/kfp308
Differential gene regulation by the human and mouse aryl hydrocarbon receptor
Abstract
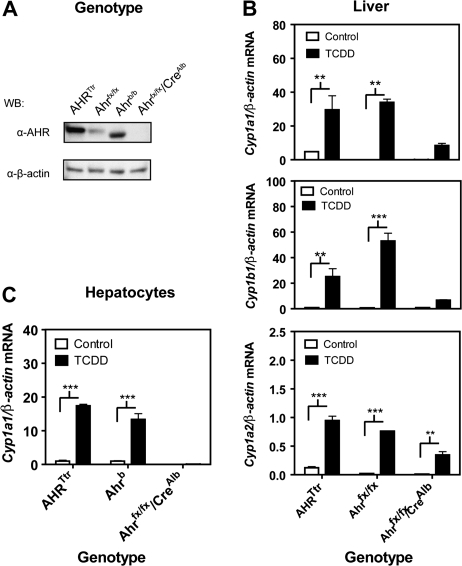
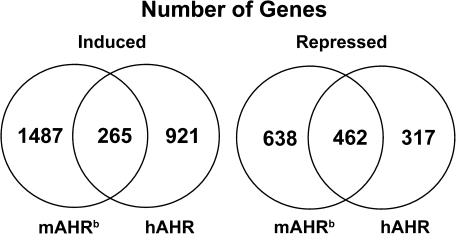
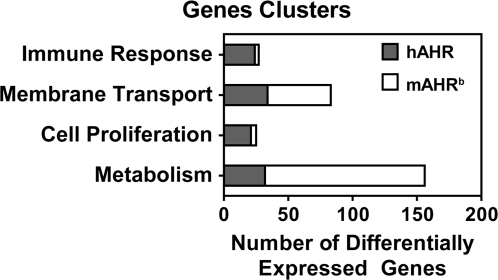
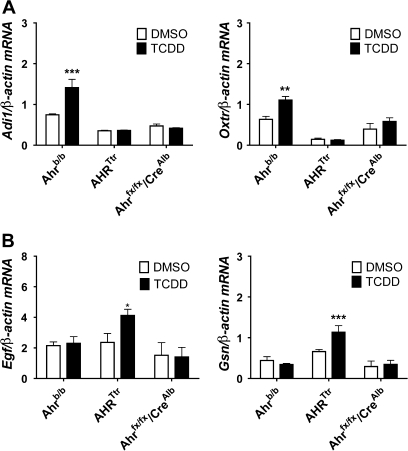
The human aryl hydrocarbon receptor (hAHR) and mouse aryl hydrocarbon receptor (mAHR(b)) share limited (58%) transactivation domain (TAD) sequence identity. Compared to the mAHR(b) allele, the hAHR displays 10-fold lower relative affinity for prototypical ligands, such as 2,3,7,8 tetrachlorodibenzo-p-dioxin (TCDD). However, in previous studies, we have demonstrated that the hAHR can display a higher relative ligand-binding affinity than the mAHR(b) for specific AHR ligands, such as indirubin. Each receptor has also been shown to differentially recruit LXXLL coactivator motif proteins and to utilize different TAD subdomains in gene transactivation. Using hepatocytes isolated from C57BL/6J mice (Ahr(b/b)) and AHR(Ttr) transgenic mice, which express hAHR protein specifically in hepatocytes, we investigated whether the hAHR and mAHR(b) differentially regulate genes. DNA microarray and quantitative PCR analysis of Ahr(b/b) and AHR(Ttr) primary mouse hepatocytes treated with 10nM TCDD revealed that a number of established AHR target genes such as Cyp1a1 and Cyp1b1 are significantly induced by both receptors. Remarkably, of the 1752 genes induced by mAHR(b) and 1186 genes induced by hAHR, only 265 genes (approximately 18%) were significantly activated by both receptors in response to TCDD. Conversely, of the 1100 and 779 genes significantly repressed in mAHR(b) and hAHR hepatocytes, respectively, only 462 (approximately 49%) genes were significantly repressed by both receptors in response to TCDD treatment. Genes identified as differentially expressed are known to be involved in a number of biological pathways, including cell proliferation and inflammatory response, which suggest that compared to the mAHR(b), the hAHR may play contrasting roles in TCDD-induced toxicity and endogenous AHR-mediated gene regulation.
Figures
Similar articles
-
Ligand selectivity and gene regulation by the human aryl hydrocarbon receptor in transgenic mice.Mol Pharmacol. 2009 Jun;75(6):1412-20. doi: 10.1124/mol.109.054825. Epub 2009 Mar 19. Mol Pharmacol. 2009. PMID: 19299563 Free PMC article.
-
Comparative In Vitro and In Silico Analysis of the Selectivity of Indirubin as a Human Ah Receptor Agonist.Int J Mol Sci. 2018 Sep 10;19(9):2692. doi: 10.3390/ijms19092692. Int J Mol Sci. 2018. PMID: 30201897 Free PMC article.
-
Use of 2-azido-3-[125I]iodo-7,8-dibromodibenzo-p-dioxin as a probe to determine the relative ligand affinity of human versus mouse aryl hydrocarbon receptor in cultured cells.Mol Pharmacol. 2004 Jul;66(1):129-36. doi: 10.1124/mol.66.1.129. Mol Pharmacol. 2004. PMID: 15213304
-
Role of coactivators in transcriptional activation by the aryl hydrocarbon receptor.Arch Biochem Biophys. 2005 Jan 15;433(2):379-86. doi: 10.1016/j.abb.2004.09.031. Arch Biochem Biophys. 2005. PMID: 15581594 Review.
-
Mechanisms of ligand-induced aryl hydrocarbon receptor-mediated biochemical and toxic responses.Toxicol Pathol. 1998 Sep-Oct;26(5):657-71. doi: 10.1177/019262339802600510. Toxicol Pathol. 1998. PMID: 9789953 Review.
Cited by
-
Targeting the aryl hydrocarbon receptor in stem cells to improve the use of food as medicine.Curr Stem Cell Rep. 2020 Dec;6(4):109-118. doi: 10.1007/s40778-020-00184-0. Epub 2021 Jan 5. Curr Stem Cell Rep. 2020. PMID: 34395177 Free PMC article.
-
Risk for animal and human health related to the presence of dioxins and dioxin-like PCBs in feed and food.EFSA J. 2018 Nov 20;16(11):e05333. doi: 10.2903/j.efsa.2018.5333. eCollection 2018 Nov. EFSA J. 2018. PMID: 32625737 Free PMC article.
-
AHR Function in Lymphocytes: Emerging Concepts.Trends Immunol. 2016 Jan;37(1):17-31. doi: 10.1016/j.it.2015.11.007. Epub 2015 Dec 11. Trends Immunol. 2016. PMID: 26700314 Free PMC article. Review.
-
Aryl hydrocarbon receptor antagonism mitigates cytokine-mediated inflammatory signalling in primary human fibroblast-like synoviocytes.Ann Rheum Dis. 2013 Oct;72(10):1708-16. doi: 10.1136/annrheumdis-2012-202639. Epub 2013 Jan 24. Ann Rheum Dis. 2013. PMID: 23349129 Free PMC article.
-
Identification of stanniocalcin 2 as a novel aryl hydrocarbon receptor target gene.J Pharmacol Exp Ther. 2013 Mar;344(3):579-88. doi: 10.1124/jpet.112.201111. Epub 2012 Dec 26. J Pharmacol Exp Ther. 2013. PMID: 23269473 Free PMC article.
References
-
- Birnbaum LS. Evidence of the role of the Ah receptor in responses to dioxin. Prog. Clin. Biol. Res. 1994;387:139–154. - PubMed
-
- Carlson EA, McCulloch C, Koganti A, Goodwin SB, Sutter TR, Silkworth JB. Divergent transcriptomic responses to aryl hydrocarbon receptor agonists between rat and human primary hepatocytes. Toxicol. Sci. 2009;112:257–272. - PubMed
-
- Cheung C, Akiyama TE, Ward JM, Nicol CJ, Feigenbaum L, Vinson C, Gonzalez FJ. Diminished hepatocellular proliferation in mice humanized for the nuclear receptor peroxisome proliferator-activated receptor alpha. Cancer Res. 2004;64:3849–3854. - PubMed
-
- Cui J, Heard TS, Yu J, Lo JL, Huang L, Li Y, Schaeffer JM, Wright SD. The amino acid residues asparagine 354 and isoleucine 372 of human farnesoid X receptor confer the receptor with high sensitivity to chenodeoxycholate. J. Biol. Chem. 2002;277:25963–25969. - PubMed
Publication types
MeSH terms
Substances
Grants and funding
LinkOut - more resources
Full Text Sources
Molecular Biology Databases
Research Materials
Miscellaneous
