. 2011 Jan;23(1):119-36.
doi: 10.1162/jocn.2010.21417.

The emergence of perceived position in the visual system

Affiliations

The emergence of perceived position in the visual system

Jason Fischer et al. J Cogn Neurosci. 2011 Jan.

Abstract

Representing object position is one of the most critical functions of the visual system, but this task is not as simple as reading off an object's retinal coordinates. A rich body of literature has demonstrated that the position in which we perceive an object depends not only on retinotopy but also on factors such as attention, eye movements, object and scene motion, and frames of reference, to name a few. Despite the distinction between perceived and retinal position, strikingly little is known about how or where perceived position is represented in the brain. In the present study, we dissociated retinal and perceived object position to test the relative precision of retina-centered versus percept-centered position coding in a number of independently defined visual areas. In an fMRI experiment, subjects performed a five-alternative forced-choice position discrimination task; our analysis focused on the trials in which subjects misperceived the positions of the stimuli. Using a multivariate pattern analysis to track the coupling of the BOLD response with incremental changes in physical and perceived position, we found that activity in higher level areas--middle temporal complex, fusiform face area, parahippocampal place area, lateral occipital cortex, and posterior fusiform gyrus--more precisely reflected the reported positions than the physical positions of the stimuli. In early visual areas, this preferential coding of perceived position was absent or reversed. Our results demonstrate a new kind of spatial topography present in higher level visual areas in which an object's position is encoded according to its perceived rather than retinal location. We term such percept-centered encoding “perceptotopy".


Figures
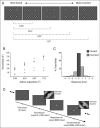
Figure 1
Figure 1
Main experimental stimuli and behavioral results. (A) On each trial, Gabor stimuli appeared at one of five possible eccentricity conditions, ranging from 8.43° to 9.65° from a central fixation point. The range of eccentricities pictured is exaggerated for visualization purposes. The Gabors flickered in counterphase at 7.5 Hz and were present for the duration of each 10 second trial. A white annulus around the fixation point during the last 2 sec of each trial cued subjects to respond, indicating which of the five conditions was present. In a sixth baseline condition, only the fixation point was present for 10 sec. The behavioral and the correlation analyses refer to the separations between the five stimulus conditions—these are indicated below the stimuli (in degrees visual angle). (B) Subjects’ sensitivity (in d’ units, see MacMillan & Creelman, 2004) is plotted against stimulus separation. The positive trend in this plot indicates that the five stimulus positions sampled the dynamic range of subjects’ discrimination sensitivity. The overall hit rate was 58%. (C) Histogram of the response errors for all trials in the main experiment, binned by the distance between the correct and the actual responses. For example, if, on a given trial, the Gabors were presented in position 4 (9.34° from fixation) but the subject responded with position 3, that trial is binned in response error (−1). The trials in solid gray at response error 0 are the trials in which subjects responded correctly; we exclusively used the missed trials (dotted bars; 42% of total trials), in which perceived and physical positions were dissociated in the analysis of the main experiment. (D) An example trial. The Gabor stimuli were present for the duration of each 10-sec trial. At a random time during the first 8 sec of each trial, a small texture (either a radial or a concentric grating) appeared for 500 msec at 9.04° from fixation in a random quadrant. During the last 2 sec of the trial, a second texture appeared at the same eccentricity in a random quadrant; the type of texture matched the first on 50% of the trials. At the end of the trial, subjects gave two responses, indicating the positions of the Gabors (5AFC) and whether the two presented textures were the same (2AFC).
Figure 2
Figure 2
Construction of a position discrimination plot. To measure position selectivity within an ROI, we created a position discrimination plot, in which the similarity between the patterns of activity produced by any two of the five stimulus conditions is plotted against the spatial separation between the stimuli presented in those conditions. We used the correlation (Pearson's r) between two patterns of BOLD response as the measure of their similarity. To compute the correlation between a given pair of activity maps, we plotted the intensity values (t units) from one map against those from the other map on a voxel-by-voxel basis and fit a linear regression to the plot. We transformed the resulting r value to a Fisher z to allow for a linear comparison among multiple correlations measured in this way. Two such correlations computed within V1 for an example subject are shown in panels A and B. The plot in panel A corresponds to two adjacent stimulus conditions, whereas the plot in panel B corresponds to the two furthest separated stimulus eccentricities. Note that the correlation in panel A is substantially stronger than that in panel B. The fact that retinotopically proximal stimuli produce similar patterns of BOLD response whereas more distant stimuli produce less similar patterns of BOLD is an indication that activity in the ROI is position selective. To evaluate the precision of position selectivity in the BOLD response, we plotted each of the 10 correlations against the distance between the stimuli that produced it and fit a linear regression to the resulting plot (C). Panel C shows the correlations from a single run; we computed the correlations on a run-by-run basis, so a full position discrimination plot for one subject had fifty total points (see Methods). A significant negative trend in this position discrimination plot indicates that activity in theROI is sensitive to the parametric position manipulation (Fischer & Whitney, 2009a, 2009b; Bressler et al., 2007).
Figure 3
Figure 3
Comparison of physical and perceived position discrimination in higher level visual areas. (A) For each ROI, we constructed a position discrimination plot, as outlined in Figure 2, separately for physical position (panel A, left) and perceived position (panel A, right). These plots are based on the exact same trials; the only difference between the two is whether the trials were coded according to their physical position, or according to subjects’ responses, in the GLM analyses. The plots in panel A show data from all subjects; to perform a group-level analysis, we fit a linear regression to all subjects’ data taken together and included a random effect of subject in the regression model to account for between-subject variance (see Methods). The goodness of fit of the linear regression captures how tightly changes in BOLD were coupled with changes in physical or perceived stimulus position, hence serving as an index of the precision of position coding. (B) The precision of physical (blue) and perceived (red) position coding is plotted side by side for each of the five higher level visual areas. Y axis units are in −Z, so a taller bar indicates a more strongly negative correlation on the position discrimination plot. Error bars indicate ±1 SEM. Coding of perceived position was significantly more precise than coding of physical position in every higher level visual area we tested (see Table 1 for statistics).
Figure 4
Figure 4
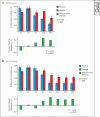
Comparison of position discrimination in higher level visual with that in early visual areas. (A) Precision of physical (blue) and perceived (red) position discrimination is shown for the dorsal visual areas in ascending order. Coding preference is captured in the green bars: they show the within-area comparison of physical versus perceived position discrimination for each visual area, obtained by subtracting the precision of physical coding from that of percept coding −(ZperceptZphysical). Positive values in the green bars indicate a preferential coding of perceived position, whereas negative values indicate a preferential coding of retinal position. Although activity in MT+ reflects perceived position more precisely than physical position, in earlier areas this bias is diminished or reversed. A chi-square test revealed that the nature of position coding differed significantly among these dorsal areas (χ2dorsal = 20.92, p = .0003). Panel B shows a comparison of perceived and physical position discrimination in the ventral visual stream. Here, too, there was significant variability between areas in the bias for representing physical or perceived position (χ2ventral = 35.29, p < .0001). To test for a systematic progression in the nature of position coding across areas, we ranked all 11 areas according to their locations in the visual processing stream (see Methods) and computed a Spearman rho rank correlation between the visual area ordering and the position coding bias −(ZperceptZphysical). The correlation was highly significant (ρ = .80; p = .003). To test this a priori ordering against all other possible rankings of visual areas, we computed a 25,000-sample bootstrapped distribution of rank correlations, with a randomly drawn ranking of areas for each sample. The correlation of .80 obtained with the a priori ranking was larger in absolute value than 99.5% of the bootstrapped samples, indicating that our ranking based on functional anatomy is a good match to the independently measured position discrimination estimates for each area. The strong correlation between an area's position in the visual processing stream and its bias for representing physical or perceived position reinforces the idea that the nature of position coding evolves as information progresses through the visual processing hierarchy, becoming relatively more strongly tied to perception in higher level areas.
Figure 5
Figure 5
Bootstrapped position discrimination analysis. To evaluate how uniquely predictive subjects’ responses were of changes in the pattern of BOLD response, relative to other possible codings of the GLM predictors, we performed the position discrimination analysis on a bootstrapped sample of 1000 sets of trial labels per subject. To generate each bootstrapped sample, we started with the physical stimulus positions and added “errors” sampled from the distribution of errors that subjects actually made during the experiment (Figure 1C). Thus, over the course of all 1000 iterations, the average errors in the GLM design matrices matched the distribution in Figure 1C. On each iteration, we obtained a group-wise position discrimination score (−Z) for each ROI; the collected position discrimination scores are plotted in the gray histograms. Of particular interest was whether subjects’ responses performed better at predicting the pattern of BOLD in higher level areas than did the random errors in the bootstrapped trial labels, which were, on average, equally well correlated with the physical stimulus positions as subjects’ responses were. In fact, in every higher level area, the percept encoding was an extreme outlier from the bootstrapped distribution (least significant was pFs; −Z = 3.41, p < .001), indicating that the precise errors that subjects made were uniquely predictive of changes in the pattern of BOLD in higher level areas. Likewise, the fact that the physical trial labels were extreme outliers from the bootstrapped distributions in lower level areas indicated that even a slight perturbation of the precise retinotopic labeling of the trials resulted in a dramatic decrease in the ability to predict changes in the pattern of BOLD response.
Figure 6
Figure 6
Control analysis with eye tracking during scanning. (A) Position discrimination data for two additional subjects scanned on the same task as in the main experiment, with eye tracking. Error bars represent ±1 SEM. The data are consistent with the results of the main experiment; the position discrimination estimates from these subjects fell within the range of estimates acquired for subjects in the main experiment in each visual area (most significant differences were MT+: zphysical = 1.81, p = .07 and PPA: Zpercept = 0.87, p = .39, for physical and percept discrimination scores, respectively). Discrimination of physical position hovered near zero for these subjects; this pattern is not atypical compared with the individual subject data from the main experiment, although there were also subjects that showed substantial discrimination of physical position (see Supplementary Figure 3). (B) Sample eye trace for one run from Subject 1a. The x position of gaze (sampled at 60 Hz) is plotted for the duration of the run, and the presentation of the five position conditions is indicated behind the trace in shades of blue. The correlation between eye position and the stimulus conditions for this run was r = .031, p = .86. The largest correlation for any run was r = .048, p = .78. The mean stimulus position, indicated with gray dashed lines, was at ±6.4° from fixation. (C) Mean values for the x position (purple) and y position (green) are shown for each of the five physical positions (left plots) and perceived positions (right plots) for the two control subjects. Eye position was not correlated with the stimulus position or the responses made for either subject (see Results for statistics). There was also no correlation between physical or perceived position and variability of eye position (see Results for statistics). (D) Collections of the recorded gaze positions corresponding to each of the physical and perceived conditions for Subject 1a. The fixation point fell at position (0,0) in the center of each plot; the scatterplots show the collected position measurements sampled during the presentation of each condition (physical plots on the left) as well as the collected eye positions corresponding to each reported condition (percept plots on the right). The adjoining histograms show the x and y distributions of recorded eye positions composing each scatterplot.

Similar articles

Cited by

References

    1. Altmann CF, Deubelius A, Kourtzi Z. Shape saliency modulates contextual processing in the human lateral occipital complex. Journal of Cognitive Neuroscience. 2004;16:794–804. - PubMed
    1. Andersen RA, Snyder LH, Bradley DC, Xing J. Multimodal representation of space in the posterior parietal cortex and its use in planning movements. Annual Review of Neuroscience. 1997;20:303–330. - PubMed
    1. Avidan G, Hasson U, Hendler T, Zohary E, Malach R. Analysis of the neuronal selectivity underlying low fMRI signals. Current Biology. 2002;12:964–972. - PubMed
    1. Benjamini Y, Hochberg Y. Controlling the false discovery rate—A practical and powerful approach to multiple testing. Journal of the Royal Statistical Society, Series B, Methodological. 1995;57:289–300.
    1. Bressler D, Spotswood N, Whitney D. Negative BOLD fMRI response in the visual cortex carries precise stimulus-specific information. PLoS ONE. 2007;2:e410. - PMC - PubMed

MeSH terms