

Interrupted catalysis: the EF4 (LepA) effect on back-translocation
- PMID: 20045415
- PMCID: PMC3138200
- DOI: 10.1016/j.jmb.2009.12.043
Interrupted catalysis: the EF4 (LepA) effect on back-translocation
Abstract
EF4, although structurally similar to the translocase EF-G, promotes back-translocation of tRNAs on the ribosome and is important for bacterial growth under certain conditions. Here, using a coordinated set of in vitro kinetic measures, including changes in the puromycin reactivity of peptidyl-tRNA and in the fluorescence of labeled tRNAs and mRNA, we elucidate the kinetic mechanism of EF4-catalyzed back-translocation and determine the effects of the translocation inhibitors spectinomycin and viomycin on the process. EF4-dependent back-translocation proceeds from a post-translocation (POST) complex to a pre-translocation (PRE) complex via a four-step kinetic scheme (i.e., POST-->I(1)-->I(2)-->I(3)-->PRE, which is not the simple reverse of translocation). During back-translocation, movements of the tRNA core regions and of mRNA are closely coupled to one another but are sometimes decoupled from movement of the 3'-end of peptidyl-tRNA. EF4 may be thought of as performing an interrupted catalysis of back-translocation, stopping at the formation of I(3) rather than catalyzing the complete process of back-translocation culminating in PRE complex formation. The delay in polypeptide elongation resulting from transient accumulation of I(3) is likely to be important for optimizing functional protein biosynthesis.
(c) 2010 Elsevier Ltd. All rights reserved.
Figures
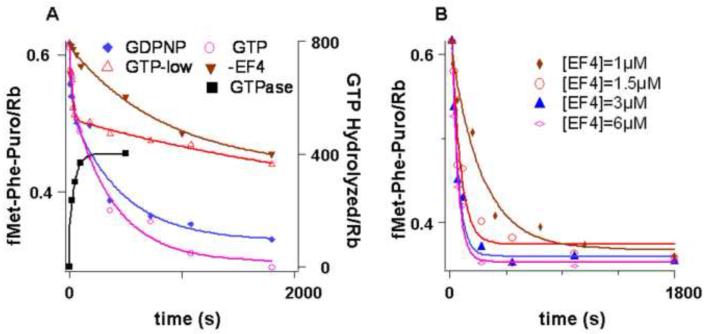
 ) -GTP, -EF4; (
 ) GTP, 2 mM, + EF4; (
 ) GTP, 0.5 mM, + EF4; (
 ) GDPNP, 0.5 mM + EF4. For GTP hydrolysis (■), the incubations were carried out with EF4 and γ-32P GTP (50 μM) followed directly by quenching. Concentrations are after mixing. B. fMetPhe-puromycin formation was carried out as in A. with varying concentrations of EF4, except that 2 mM puromycin was employed.
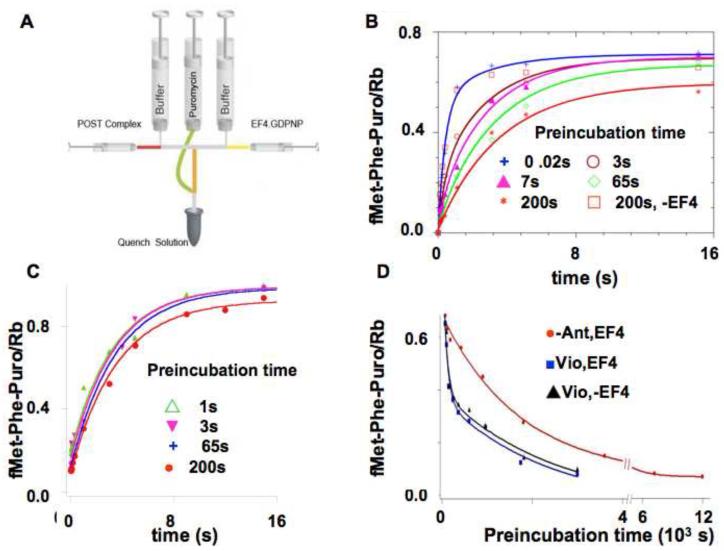
 ); 3 s (
 ); 7 s (
 ); 65 s (
 ); 200 s (
 )] prior to rapid mixing and incubation with 5 mM puromycin for up to 50 s, and quenching. The preincubation mixtures contained 0.1 μM POST complex, 3 μM EF4•GDPNP and 0.15 μM E.coli tRNAfMet. Lines through the data are fits to Scheme 1 (Figure 5). A control sample in which preincubation was carried out for 200 s in the absence of EF4 showed no loss in puromycin reactivity (
 ).C. As described in B, but in the presence of 5 mM spectinomycin. Preincubation times were: 1 s (
 ); 3 s (
 ); 65 s (
 ); 200 s (
 ). All traces are fit by single exponential, with an apparent rate constant of 0.30 ± 0.03 s−1. D. The effect of long pre-incubation times. 0.1 μM of POST complex was preincubated for the times indicated with 0.15 μM E.coli tRNAfMet and various other combinations [3 μM EF4•GDPNP (
 ); 3 μM EF4•GDPNP plus 1 mM Vio (
 ); 1 mM Vio in the absence of EF4 (▲)], prior to incubation with puromycin (5 mM) for 20 s prior to quenching. The EF4•GDPNP trace is fit to a single exponential, giving an apparent rate constant of 7.9± 0.5 × 10⁻⁴ s−1. The EF4•GDPNP plus 1 mM Vio and 1 mM Vio alone traces are fit by double exponentials, giving identical values of 0.011 ± 0.005 s−1 and 8.8 ± 0.9 × 10⁻⁴ s−1 for each trace.
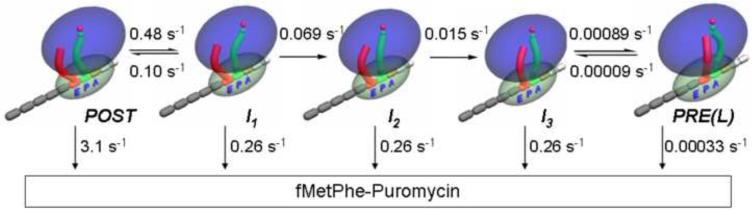
Similar articles
-
EF-G and EF4: translocation and back-translocation on the bacterial ribosome.Nat Rev Microbiol. 2014 Feb;12(2):89-100. doi: 10.1038/nrmicro3176. Epub 2013 Dec 23. Nat Rev Microbiol. 2014. PMID: 24362468 Review.
-
A new tRNA intermediate revealed on the ribosome during EF4-mediated back-translocation.Nat Struct Mol Biol. 2008 Sep;15(9):910-5. doi: 10.1038/nsmb.1469. Nat Struct Mol Biol. 2008. PMID: 19172743
-
EF4 disengages the peptidyl-tRNA CCA end and facilitates back-translocation on the 70S ribosome.Nat Struct Mol Biol. 2016 Feb;23(2):125-31. doi: 10.1038/nsmb.3160. Epub 2016 Jan 25. Nat Struct Mol Biol. 2016. PMID: 26809121
-
The conserved protein EF4 (LepA) modulates the elongation cycle of protein synthesis.Proc Natl Acad Sci U S A. 2011 Sep 27;108(39):16223-8. doi: 10.1073/pnas.1103820108. Epub 2011 Sep 19. Proc Natl Acad Sci U S A. 2011. PMID: 21930951 Free PMC article.
-
The paradox of elongation factor 4: highly conserved, yet of no physiological significance?Biochem J. 2013 Jun 1;452(2):173-81. doi: 10.1042/BJ20121792. Biochem J. 2013. PMID: 23662805 Review.
Cited by
-
Monitoring translation with modified mRNAs strategically labeled with isomorphic fluorescent guanosine mimetics.ACS Chem Biol. 2013 Sep 20;8(9):2017-23. doi: 10.1021/cb400256h. Epub 2013 Jul 18. ACS Chem Biol. 2013. PMID: 23865809 Free PMC article.
-
EF-G and EF4: translocation and back-translocation on the bacterial ribosome.Nat Rev Microbiol. 2014 Feb;12(2):89-100. doi: 10.1038/nrmicro3176. Epub 2013 Dec 23. Nat Rev Microbiol. 2014. PMID: 24362468 Review.
-
Ribosomal elongation factor 4 promotes cell death associated with lethal stress.mBio. 2014 Dec 9;5(6):e01708. doi: 10.1128/mBio.01708-14. mBio. 2014. PMID: 25491353 Free PMC article.
-
CpLEPA is critical for chloroplast protein synthesis under suboptimal conditions in Arabidopsis thaliana.PLoS One. 2012;7(11):e49746. doi: 10.1371/journal.pone.0049746. Epub 2012 Nov 15. PLoS One. 2012. PMID: 23166764 Free PMC article.
-
Elongation factor 4 (EF4/LepA) accelerates protein synthesis at increased Mg2+ concentrations.Proc Natl Acad Sci U S A. 2011 Feb 22;108(8):3199-203. doi: 10.1073/pnas.1012994108. Epub 2011 Feb 7. Proc Natl Acad Sci U S A. 2011. PMID: 21300907 Free PMC article.
References
-
- Qin Y, Polacek N, Vesper O, Staub E, Einfeldt E, Wilson DN, Nierhaus KH. The highly conserved LepA is a ribosomal elongation factor that back-translocates the ribosome. Cell. 2006;127:721–733. - PubMed
-
- Konevega AL, Fischer N, Semenkov YP, Stark H, Wintermeyer W, Rodnina MV. Spontaneous reverse movement of mRNA-bound tRNA through the ribosome. Nat Struct Mol Biol. 2007;14:318–324. - PubMed
Publication types
MeSH terms
Substances
Grants and funding
LinkOut - more resources
Full Text Sources
Molecular Biology Databases
