

Patterns of beverage use across the lifecycle
- PMID: 20045423
- PMCID: PMC2849916
- DOI: 10.1016/j.physbeh.2009.12.022
Patterns of beverage use across the lifecycle
Abstract
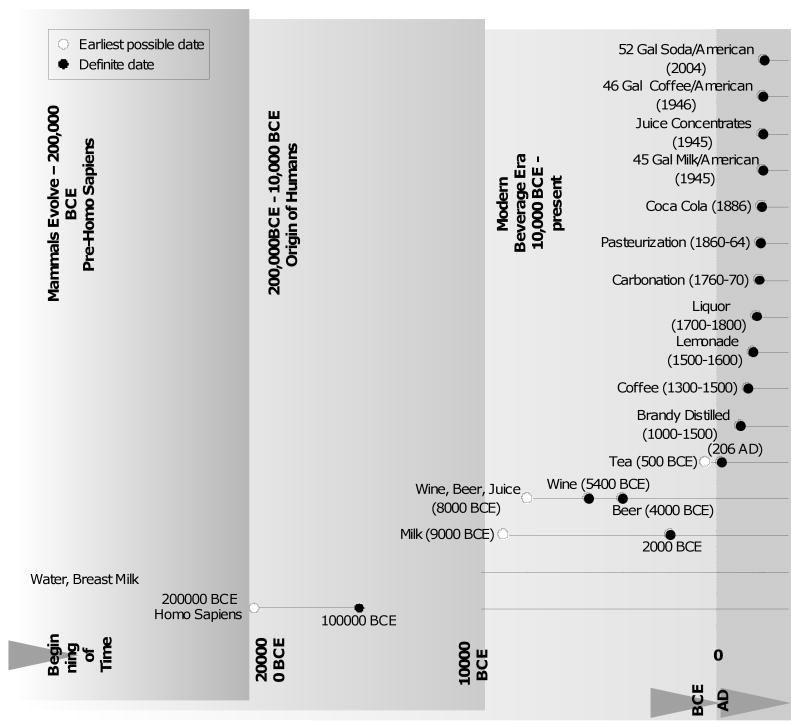
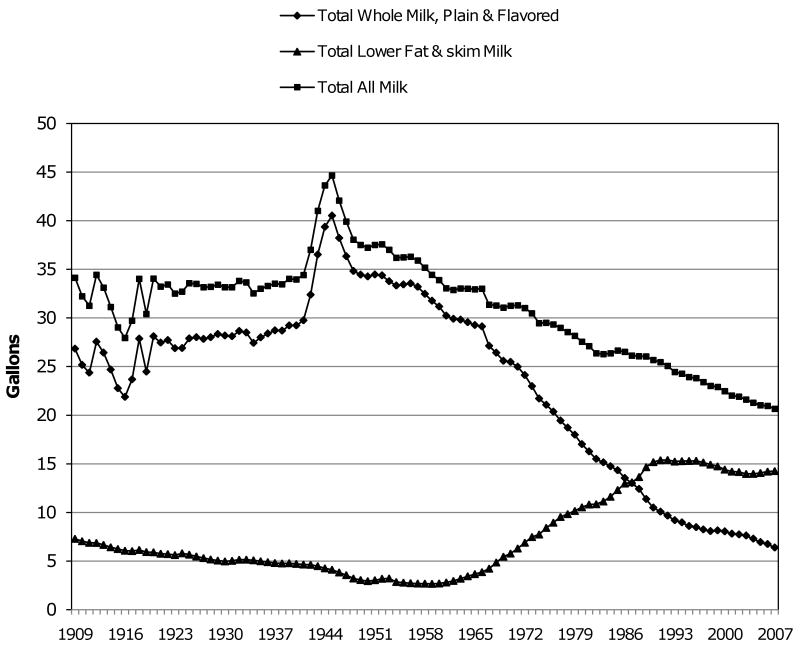
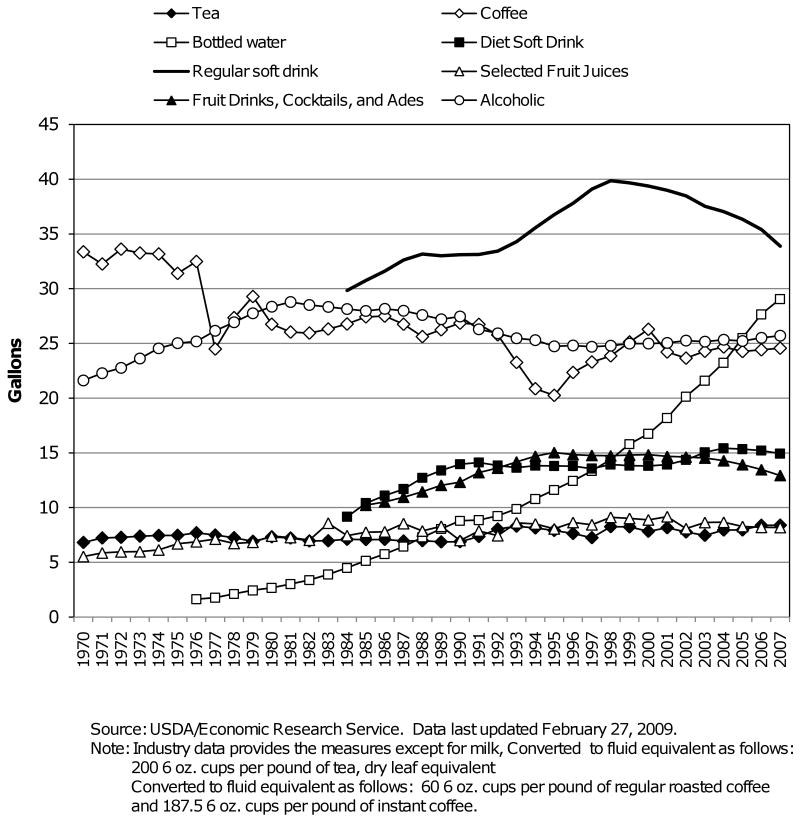
Total beverage intake patterns have changed greatly over the past half century. The present research was conducted to evaluate historic and current patterns of beverage consumption of adults and children in the U.S. Data were drawn from food balance surveys along with two-day beverage intake averages and were weighted to be nationally representative. A marked slow continuous shift downward in total milk intake with a shift toward an increased proportion of reduced fat milk was determined. The biggest shifts in beverage consumption among children aged 2 to18 were an increase in sugar-sweetened beverages (SSBs) (from 87 to 154kcal/d), a smaller increase in juices (+21kcal/d), and a decrease in milk consumption (-91kcal/d). Data among adults aged 19 and older indicated that SSB intake has more than doubled. Water intake was highly variable, with a marked increase in bottled water intake but no clear trend in total water intake. Overall trends by age were presented and indicated that age-related beverage intake, both in ounces and kcal/day, decreased sharply for adults aged 60 and older. Kcal/d values ranged from a low of 283 for those over age 60 to a peak of 533 for those aged 19 to39 to 367 for 2 to 6year olds. The consumer shift toward increased levels of SSBs and alcohol, limited amounts of reduced fat milk along with a continued consumption of whole milk, and increased juice intake represent issues to address from a public health perspective.
Copyright 2010 Elsevier Inc. All rights reserved.
Figures
References
-
- Wood BA. The History of the Genus Homo. In: Ciochon RL, Fleagle JG, editors. The human evolution source book. Upper Saddle River, N.J.: Pearson Prentice Hall; 2006. pp. 222–7.
-
- Ciochon RL, Fleagle JG. Evolution of Homo Sapiens. In: Ciochon RL, Fleagle JG, editors. The human evolution source book. Upper Saddle River, N.J.: Pearson Prentice Hall; 2006. pp. 601–3.
-
- DiMeglio D, Mattes R. Liquid versus solid carbohydrate: effects on food intake and body weight. Int J Obes Relat Metab Disord. 2000;24:794–800. - PubMed
-
- Mattes R. Fluid energy-where's the problem? J Am Diet Assoc. 2006;106:1956–1961. - PubMed
-
- Mourao D, Bressan J, Campbell W, Mattes R. Effects of food form on appetite and energy intake in lean and obese young adults. Int J Obes (Lond) 2007;31:1688–95. - PubMed
Publication types
MeSH terms
Grants and funding
LinkOut - more resources
Full Text Sources
Miscellaneous
