

Perceiving parts and shapes from concave surfaces
- PMID: 20045886
- PMCID: PMC2805109
- DOI: 10.3758/72.1.153
Perceiving parts and shapes from concave surfaces
Abstract
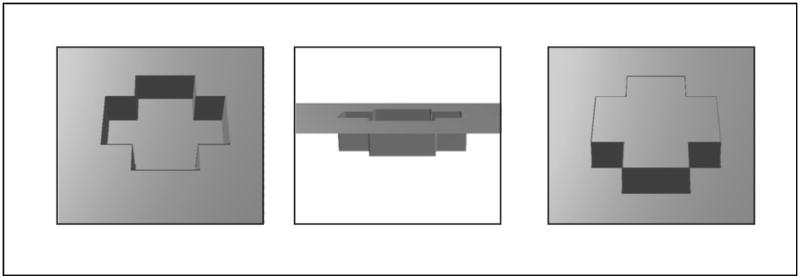
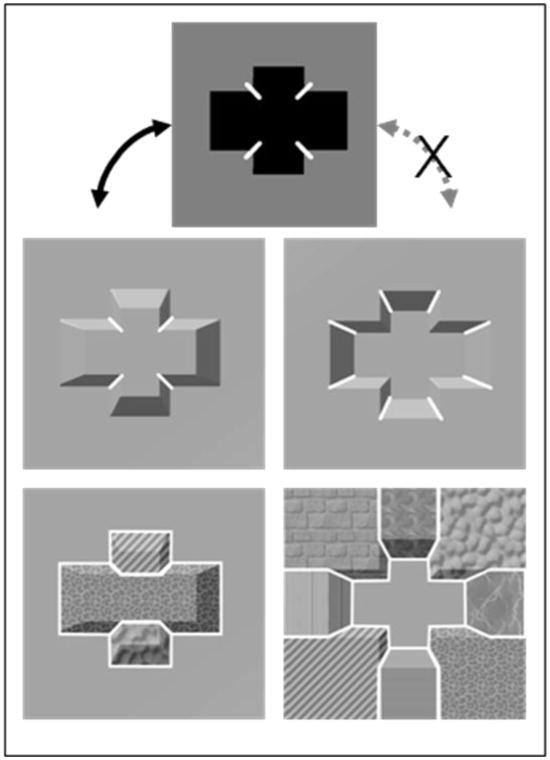
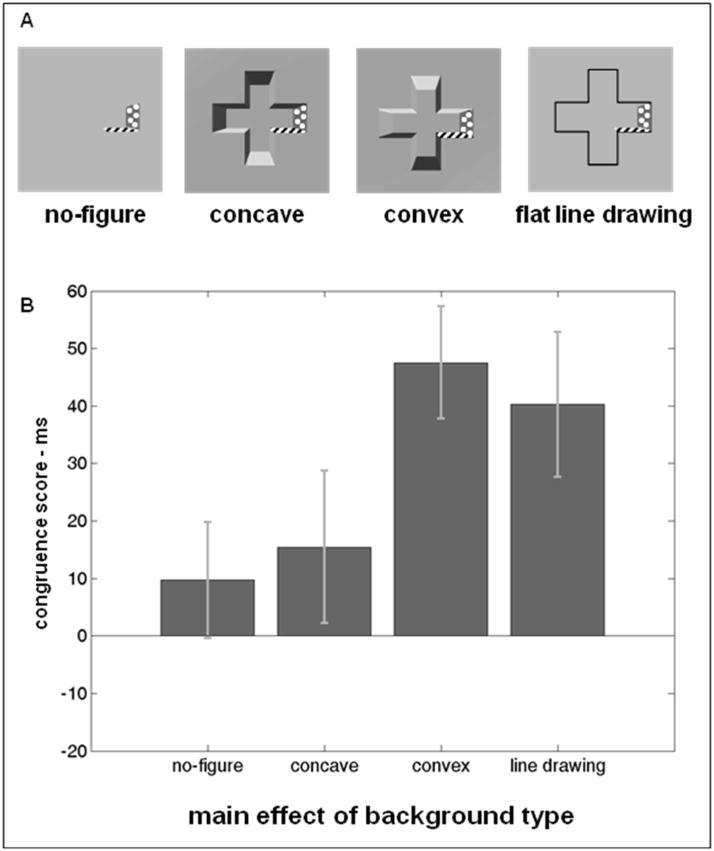
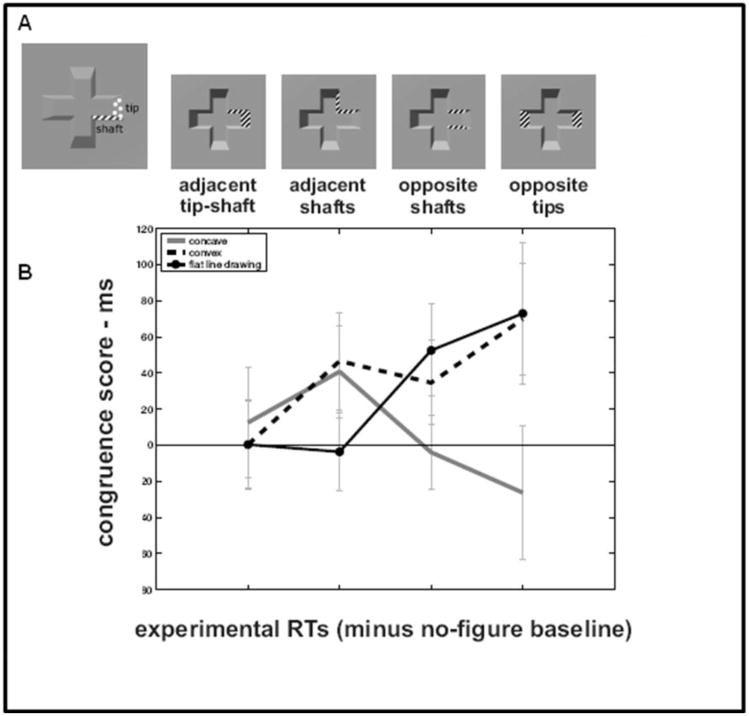
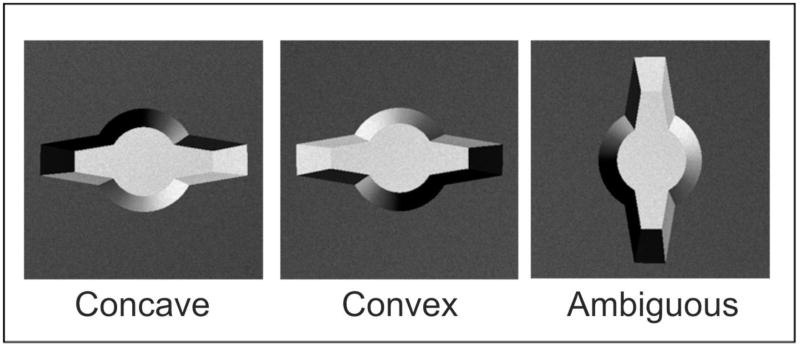
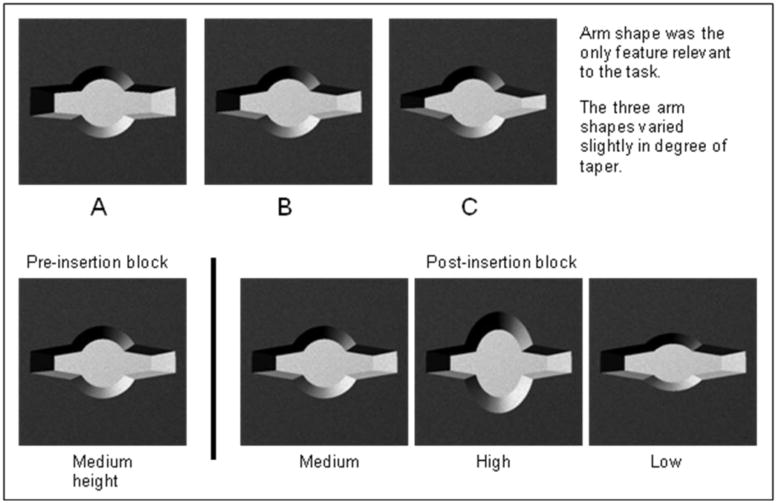
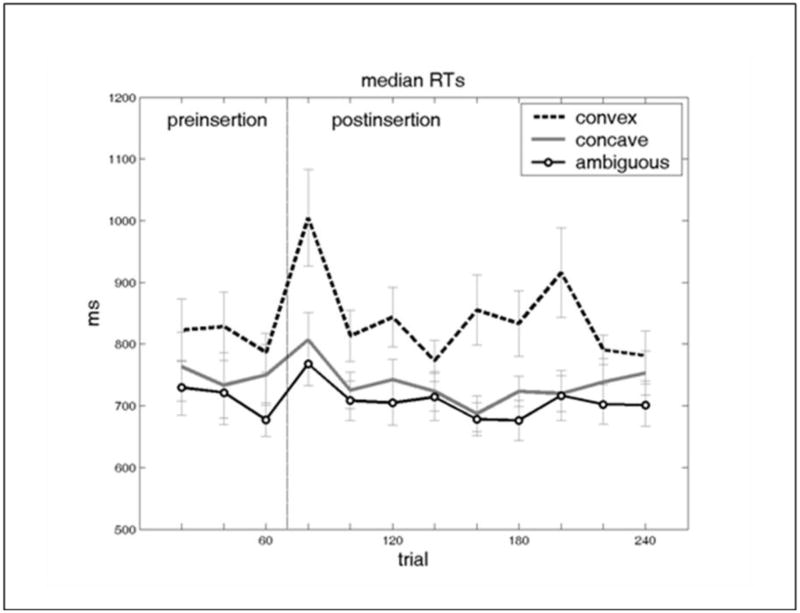
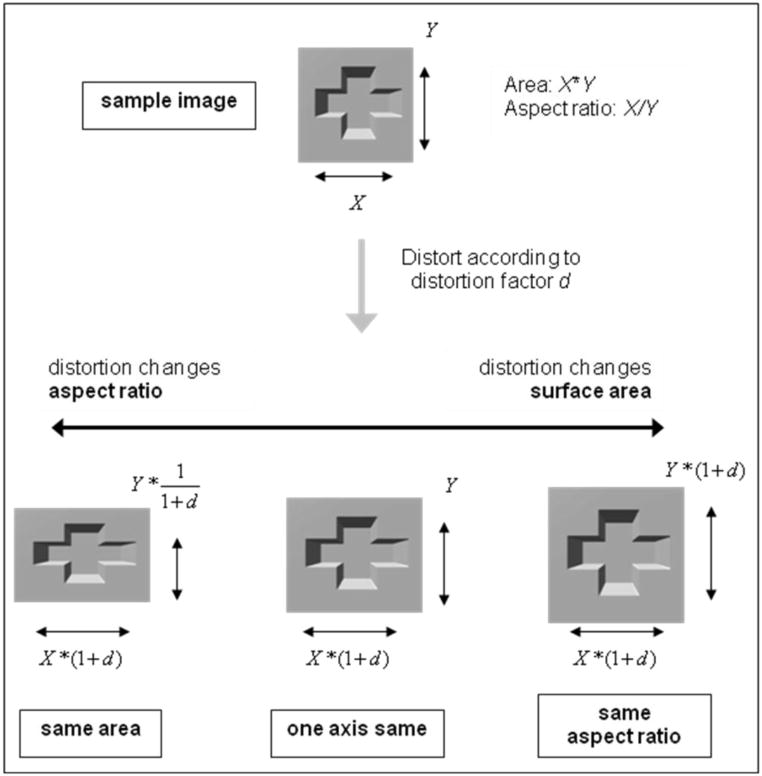
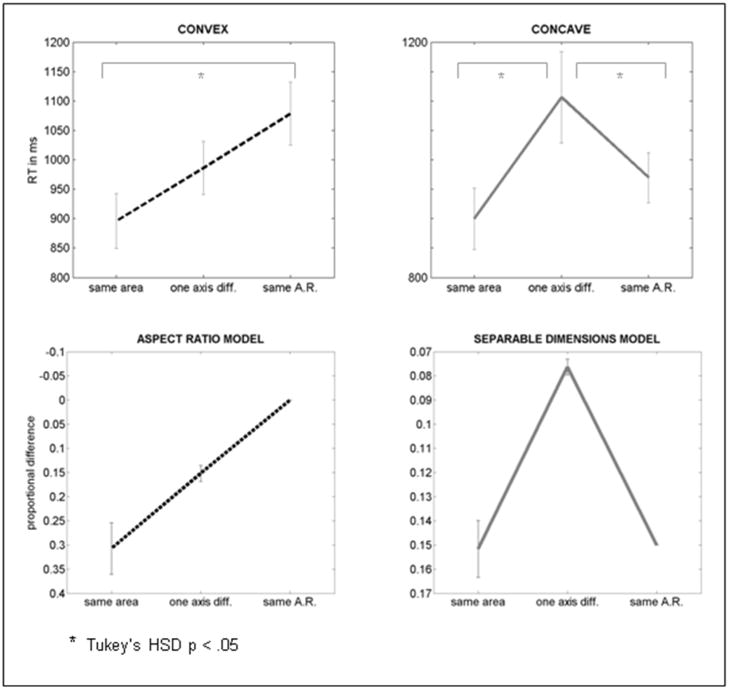
"A hole is nothing at all, but it can break your neck." In a similar fashion to the danger illustrated by this folk paradox, concave regions pose difficulties to theories of visual shape perception. We can readily identify their shapes, but according to principles of how observers determine part boundaries, concavities in a planar surface should have very different figural shapes from the ones that we perceive. In three experiments, we tested the hypothesis that observers perceive local image features differently in simulated 3-D concave and convex regions but use them to arrive at similar shape percepts. Stimuli were shape-from-shading images containing regions that appeared either concave or convex in depth, depending on their orientation in the picture plane. The results show that concavities did not benefit from the same global object-based attention or holistic shape encoding as convexities and that the participants relied on separable spatial dimensions to judge figural shape in concavities. Concavities may exploit a secondary process for shape perception that allows regions composed of perceptually independent features to ultimately be perceived as gestalts.
Figures
Similar articles
-
Observer strategies in perception of 3-D shape from isotropic textures: developable surfaces.Vision Res. 2003 Dec;43(26):2741-58. doi: 10.1016/j.visres.2003.07.001. Vision Res. 2003. PMID: 14568092
-
Infants' perception of information along object boundaries: concavities versus convexities.J Exp Child Psychol. 2006 Jun;94(2):91-113. doi: 10.1016/j.jecp.2006.01.002. Epub 2006 Mar 3. J Exp Child Psychol. 2006. PMID: 16516223
-
Concavities count for less in symmetry perception.Psychon Bull Rev. 2007 Dec;14(6):1212-7. doi: 10.3758/bf03193115. Psychon Bull Rev. 2007. PMID: 18229499
-
Depth inversion with a 3D structure influences brightness perception.PLoS One. 2019 Oct 18;14(10):e0224192. doi: 10.1371/journal.pone.0224192. eCollection 2019. PLoS One. 2019. PMID: 31626683 Free PMC article.
-
Processing convexity and concavity along a 2-D contour: figure-ground, structural shape, and attention.Psychon Bull Rev. 2013 Apr;20(2):191-207. doi: 10.3758/s13423-012-0347-2. Psychon Bull Rev. 2013. PMID: 23188740 Review.
Cited by
-
Perception and Past Experience 50 Years After Kanizsa's (Im)possible Experiment.Perception. 2020 Mar;49(3):247-267. doi: 10.1177/0301006619899005. Epub 2020 Jan 22. Perception. 2020. PMID: 31965905 Free PMC article. Review.
-
The shading cue in context.Iperception. 2010;1(3):159-78. doi: 10.1068/i0401. Epub 2010 Dec 21. Iperception. 2010. PMID: 23145221 Free PMC article.
-
Perceptual influence of elementary three-dimensional geometry: (2) fundamental object parts.Front Psychol. 2015 Sep 24;6:1427. doi: 10.3389/fpsyg.2015.01427. eCollection 2015. Front Psychol. 2015. PMID: 26441797 Free PMC article.
-
Perceptual influence of elementary three-dimensional geometry: (1) objectness.Front Psychol. 2015 Aug 28;6:1317. doi: 10.3389/fpsyg.2015.01317. eCollection 2015. Front Psychol. 2015. PMID: 26379613 Free PMC article.
-
Shape information mediating basic- and subordinate-level object recognition revealed by analyses of eye movements.J Exp Psychol Hum Percept Perform. 2014 Apr;40(2):451-6. doi: 10.1037/a0034983. Epub 2013 Dec 23. J Exp Psychol Hum Percept Perform. 2014. PMID: 24364701 Free PMC article.
References
-
- Barenholtz E, Cohen EH, Feldman J, Singh M. Detection of change in shape: an advantage for concavities. Cognition. 2003;89(1):1–9. - PubMed
-
- Barenholtz E, Feldman J. Visual comparisons within and between object parts: evidence for a single-part superiority effect. Vision Res. 2003;43(15):1655–1666. - PubMed
-
- Baylis GC, Driver J. Visual attention and objects: evidence for hierarchical coding of location. J Exp Psychol Hum Percept Perform. 1993;19(3):451–470. - PubMed
-
- Behrmann M, Kimchi R. What does visual agnosia tell us about perceptual organization and its relationship to object perception? J Exp Psychol Hum Percept Perform. 2003;29(1):19–42. - PubMed
-
- Bertamini M, Croucher CJ. The shape of holes. Cognition. 2003;87(1):33–54. - PubMed
Publication types
MeSH terms
Grants and funding
LinkOut - more resources
Full Text Sources