

System-level control to optimize glucagon counterregulation by switch-off of α-cell suppressing signals in β-cell deficiency
- PMID: 20046648
- PMCID: PMC2769841
- DOI: 10.1177/193229680900300104
System-level control to optimize glucagon counterregulation by switch-off of α-cell suppressing signals in β-cell deficiency
Abstract
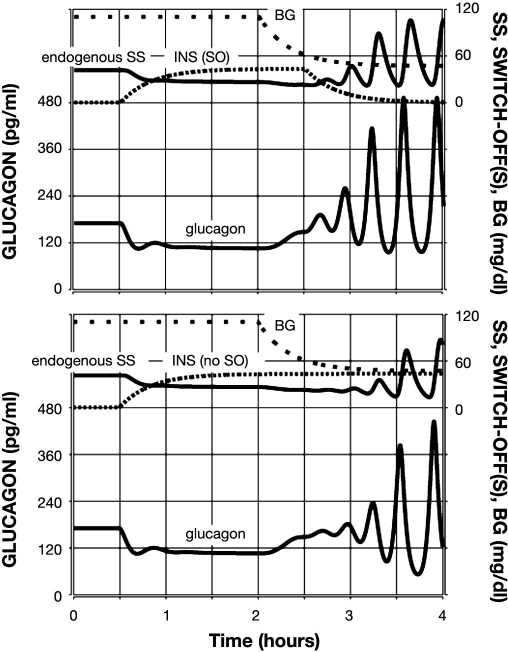
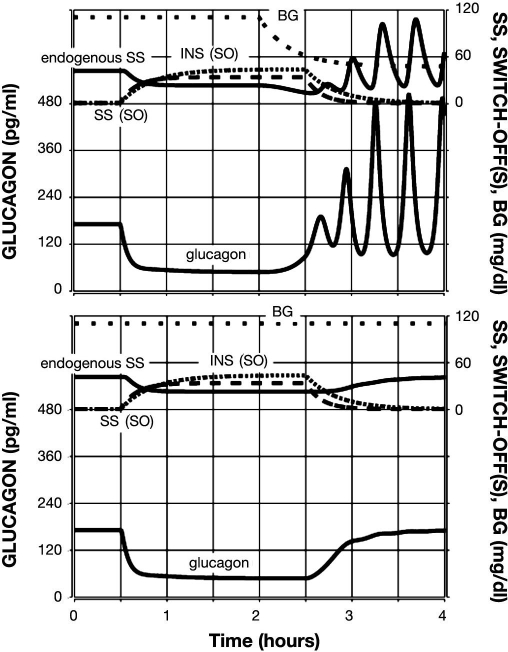
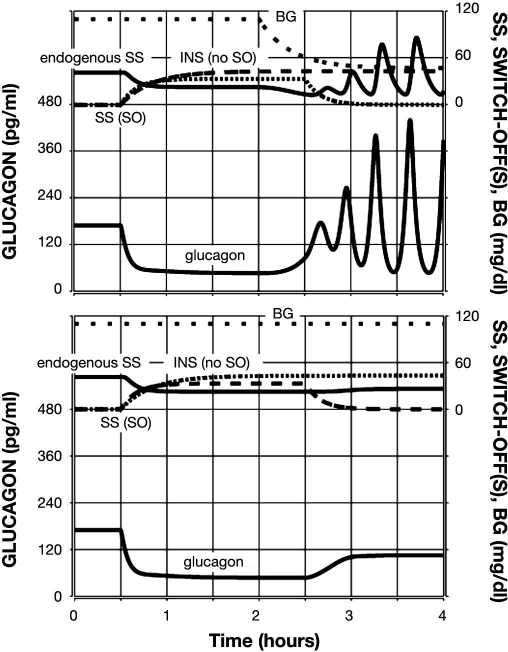
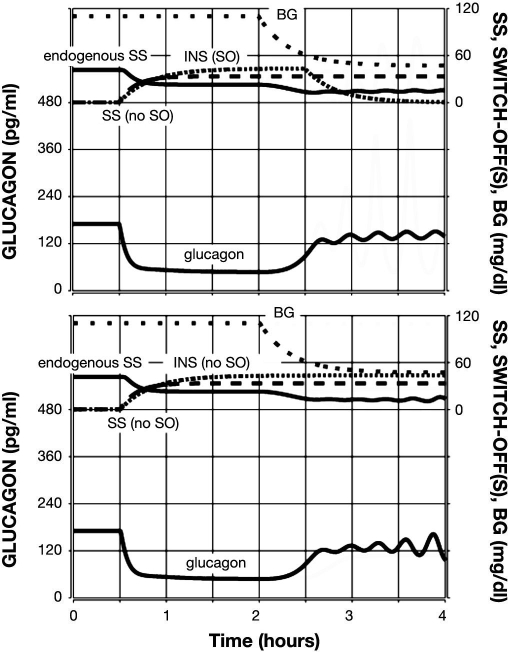
Background: Glucagon counterregulation (GCR) is a key protection against hypoglycemia that is compromised in diabetes. In β-cell-deficient rats, GCR pulsatility can be amplified if insulin (INS) or somatostatin (SS) are infused in the pancreatic artery and then switched off during hypoglycemia. The data indicate that these signals act by different mechanisms, and here we analyze the differences between the two switch offs (SOs) and predict the GCR-amplifying effect of their individual or combined application.
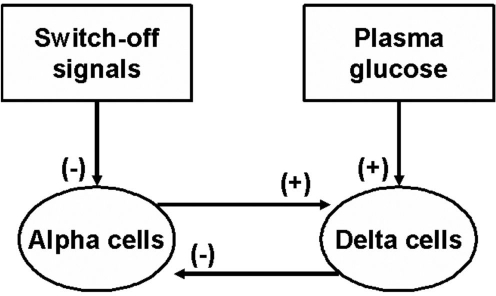
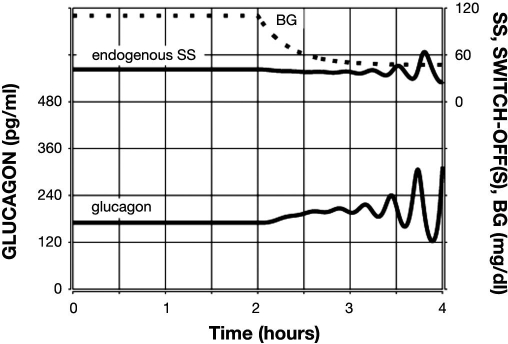
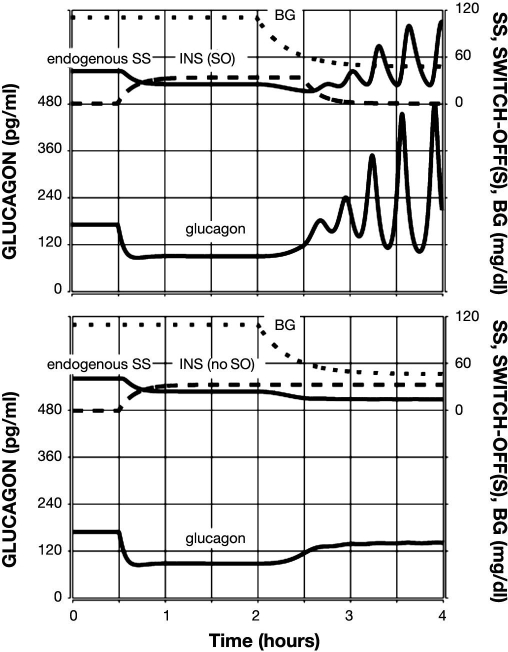
Methods: A minimal control network (MCN) of α/δ-cell interactions is approximated by differential equations to explain the GCR response to a SO and test in silico the hypotheses: (i) INS SO suppresses basal and pulsatile, while SS SO blocks only pulsatile glucagon release and (ii) simultaneous application of the two switch offs will augment the individual GCR response.
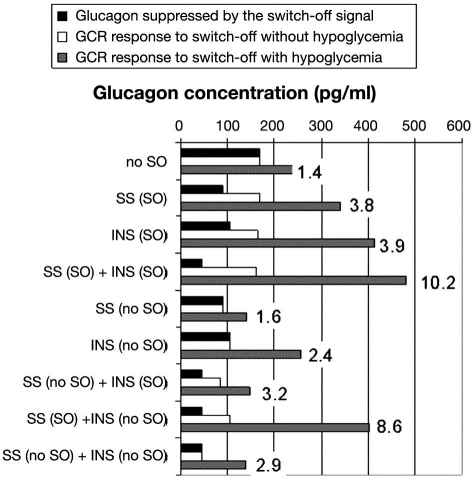
Results: The mechanism postulated in (i) explains the differences in the GCR responses between the SOs. The MCN predicts that simultaneous application of INS and SS decreases basal glucagon but increases post-SO amplitude, thus doubling the response of GCR achieved by each of the individual signals.
Conclusion: The current analyses predict that INS and SS SOs improve defective GCR in β-cell deficiency through different but complementary mechanisms and suggest SO strategies to maximally enhance GCR in type 1 diabetes by simultaneous manipulation of the network control. These results are clinically relevant, as they could have application to design of an artificial pancreas by providing ways to augment GCR that would not require glucagon infusion.
Keywords: counterregulation; feedback; glucagon; hypoglycemia; intrapancreatic network; mathematical model.
© Diabetes Technology Society
Figures
Similar articles
-
Models of glucagon secretion, their application to the analysis of the defects in glucagon counterregulation and potential extension to approximate glucagon action.J Diabetes Sci Technol. 2010 Nov 1;4(6):1345-56. doi: 10.1177/193229681000400608. J Diabetes Sci Technol. 2010. PMID: 21129329 Free PMC article.
-
Pancreatic network control of glucagon secretion and counterregulation.Methods Enzymol. 2009;467:547-581. doi: 10.1016/S0076-6879(09)67021-X. Methods Enzymol. 2009. PMID: 19897107 Free PMC article.
-
Optimizing reduction in basal hyperglucagonaemia to repair defective glucagon counterregulation in insulin deficiency.Diabetes Obes Metab. 2011 Oct;13 Suppl 1(0 1):133-43. doi: 10.1111/j.1463-1326.2011.01455.x. Diabetes Obes Metab. 2011. PMID: 21824267 Free PMC article. Review.
-
Amplification of pulsatile glucagon counterregulation by switch-off of alpha-cell-suppressing signals in streptozotocin-treated rats.Am J Physiol Endocrinol Metab. 2008 Sep;295(3):E575-85. doi: 10.1152/ajpendo.90372.2008. Epub 2008 Jun 24. Am J Physiol Endocrinol Metab. 2008. PMID: 18577688 Free PMC article.
-
Minireview: Glucagon in the pathogenesis of hypoglycemia and hyperglycemia in diabetes.Endocrinology. 2012 Mar;153(3):1039-48. doi: 10.1210/en.2011-1499. Epub 2011 Dec 13. Endocrinology. 2012. PMID: 22166985 Free PMC article. Review.
Cited by
-
Models of glucagon secretion, their application to the analysis of the defects in glucagon counterregulation and potential extension to approximate glucagon action.J Diabetes Sci Technol. 2010 Nov 1;4(6):1345-56. doi: 10.1177/193229681000400608. J Diabetes Sci Technol. 2010. PMID: 21129329 Free PMC article.
-
Pancreatic network control of glucagon secretion and counterregulation.Methods Enzymol. 2009;467:547-581. doi: 10.1016/S0076-6879(09)67021-X. Methods Enzymol. 2009. PMID: 19897107 Free PMC article.
-
Optimizing reduction in basal hyperglucagonaemia to repair defective glucagon counterregulation in insulin deficiency.Diabetes Obes Metab. 2011 Oct;13 Suppl 1(0 1):133-43. doi: 10.1111/j.1463-1326.2011.01455.x. Diabetes Obes Metab. 2011. PMID: 21824267 Free PMC article. Review.
-
Treating type 1 diabetes: from strategies for insulin delivery to dual hormonal control.Minerva Endocrinol. 2013 Jun;38(2):145-63. Minerva Endocrinol. 2013. PMID: 23732369 Free PMC article. Review.
-
Association of Basal hyperglucagonemia with impaired glucagon counterregulation in type 1 diabetes.Front Physiol. 2012 Feb 28;3:40. doi: 10.3389/fphys.2012.00040. eCollection 2012. Front Physiol. 2012. PMID: 22403550 Free PMC article.
References
-
- Cryer PE, Gerich JE. Relevance of glucose counterregulatory systems to patients with diabetes: critical roles of glucagon and epinephrine. Diabetes Care. 1993;6(1):95–99. - PubMed
-
- Gerich JE. Lilly lecture 1988. Glucose counterregulation and its impact on diabetes mellitus. Diabetes. 1988;37(12):1608–1617. - PubMed
-
- Cryer PE. Hypoglycemia is the limiting factor in the management of diabetes. Diabetes Metab Res Rev. 1999;15(1):42–46. - PubMed
-
- Cryer PE. Hypoglycemia: the limiting factor in the glycaemic management of type I and type II diabetes. Diabetologia. 2002;45(7):937–948. - PubMed
-
- Brelje TC, Scharp DW, Sorenson RL. Three-dimensional imaging of intact isolated islets of Langerhans with confocal microscopy. Diabetes. 1989;38(6):808–814. - PubMed
Publication types
MeSH terms
Substances
Grants and funding
LinkOut - more resources
Full Text Sources
Medical
