. 2009 Oct 1;56(5):2750-2758.
doi: 10.1109/TNS.2009.2026417.

Rapid Multi-Tracer PET Tumor Imaging With F-FDG and Secondary Shorter-Lived Tracers

Affiliations

Rapid Multi-Tracer PET Tumor Imaging With F-FDG and Secondary Shorter-Lived Tracers

Noel F Black et al. IEEE Trans Nucl Sci. .

Abstract

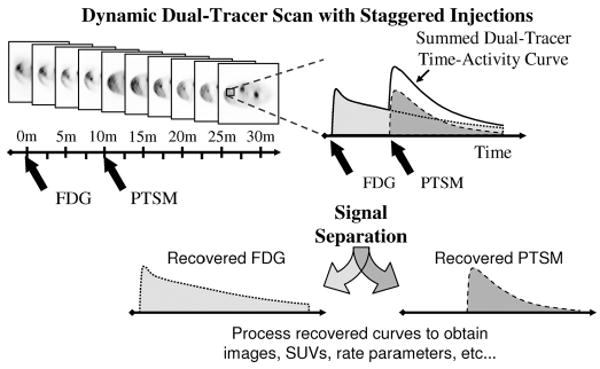
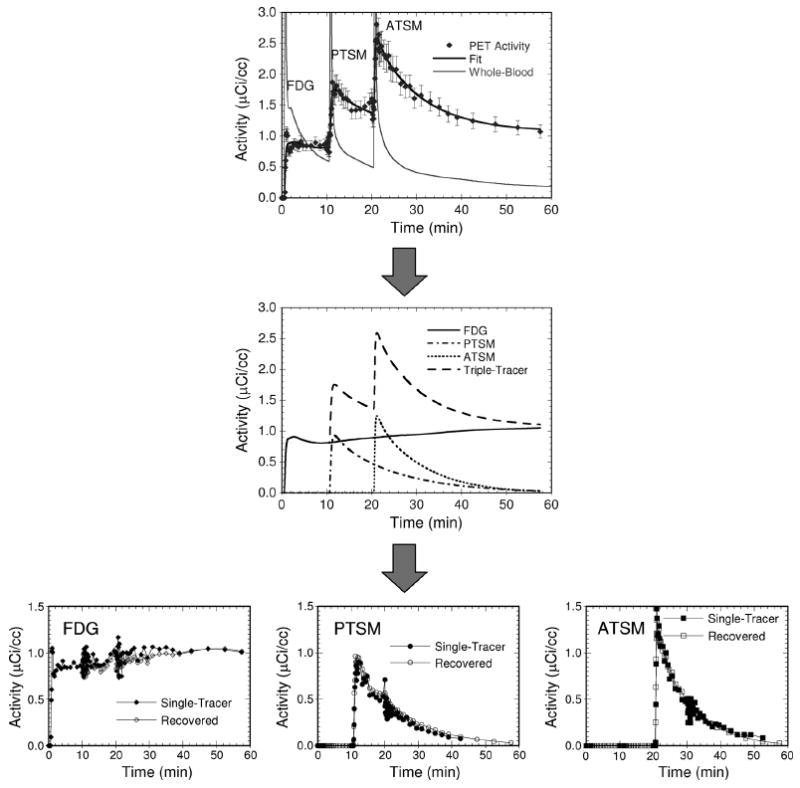
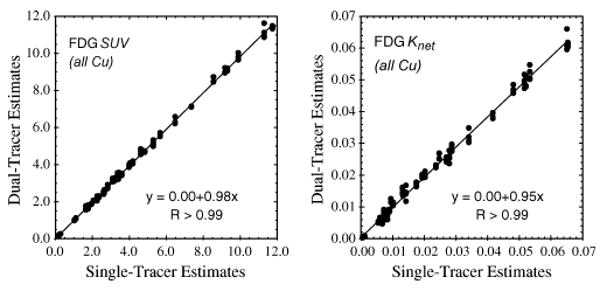
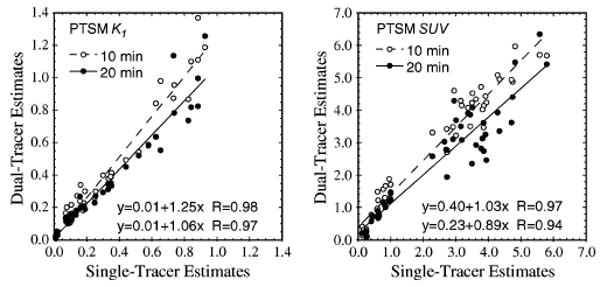
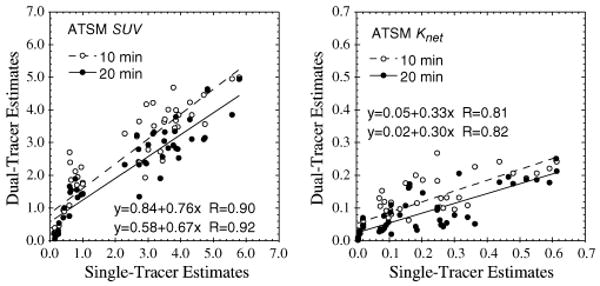
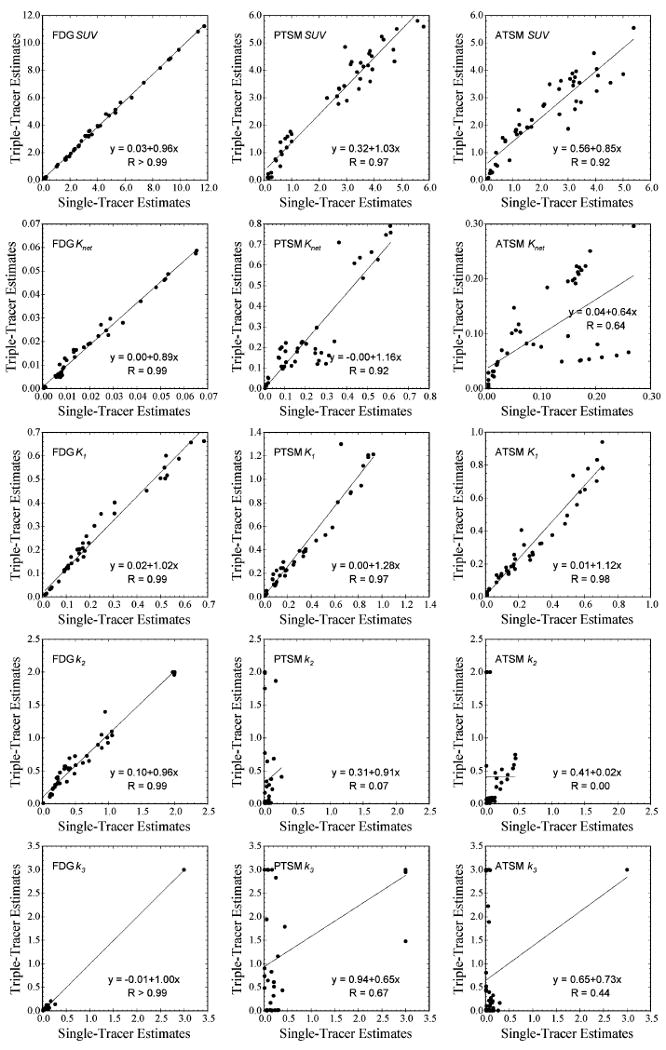
Rapid multi-tracer PET, where two to three PET tracers are rapidly scanned with staggered injections, can recover certain imaging measures for each tracer based on differences in tracer kinetics and decay. We previously showed that single-tracer imaging measures can be recovered to a certain extent from rapid dual-tracer (62)Cu - PTSM (blood flow) + (62)Cu - ATSM (hypoxia) tumor imaging. In this work, the feasibility of rapidly imaging (18)F-FDG plus one or two of these shorter-lived secondary tracers was evaluated in the same tumor model. Dynamic PET imaging was performed in four dogs with pre-existing tumors, and the raw scan data was combined to emulate 60 minute long dual- and triple-tracer scans, using the single-tracer scans as gold standards. The multi-tracer data were processed for static (SUV) and kinetic (K(1), K(net)) endpoints for each tracer, followed by linear regression analysis of multi-tracer versus single-tracer results. Static and quantitative dynamic imaging measures of FDG were both accurately recovered from the multi-tracer scans, closely matching the single-tracer FDG standards (R > 0.99). Quantitative blood flow information, as measured by PTSM K(1) and SUV, was also accurately recovered from the multi-tracer scans (R = 0.97). Recovery of ATSM kinetic parameters proved more difficult, though the ATSM SUV was reasonably well recovered (R = 0.92). We conclude that certain additional information from one to two shorter-lived PET tracers may be measured in a rapid multi-tracer scan alongside FDG without compromising the assessment of glucose metabolism. Such additional and complementary information has the potential to improve tumor characterization in vivo, warranting further investigation of rapid multi-tracer techniques.


Figures

Fig. 1
Fig. 1
In rapid dual-tracer PET, a dynamic scan is obtained with staggered injections of each tracer. Differences in the kinetic behavior of each tracer, along with the offset injections, permit separation of the dual-tracer time-activity curves into single-tracer components, which can then be analyzed using the usual single-tracer methods to obtain static or dynamic imaging measures as desired.
Fig. 2
Fig. 2
Separate single-tracer scans were acquired using the multi-tracer dynamic scanning protocol (top). The raw data from each scan were then combined to emulate rapid multi-tracer scans (triple-tracer shown at bottom), providing exactly paired single- and multi-tracer components permitting direct evaluation of the accuracy of the multi-tracer signal separation procedure. In practice, separate single-tracer scans would require 5 hr 10 min or longer to complete in order to wait for decay of one tracer before imaging the next, whereas the rapid triple-tracer procedure can be completed in the time required for a single FDG scan alone.
Fig. 3
Fig. 3
Kinetic models with two tissue compartments and three rate parameters were used for all three tracers studied here, where the second compartment had irreversible trapping. The radioactive decay of each tracer was explicitly incorporated into the model.
Fig. 4
Fig. 4
The triple tracer time-activity curve (top) is fit to the triple-tracer compartment model, producing parameterized time-activity curves for each individual tracer (middle). These single-tracer curves are used to predict relative activity values for each tracer at each time-point. These fractions are applied to the original triple-tracer curve to give the recovered single-tracer curves (bottom). The error bars shown on the top plot are the weights used for the multi-tracer compartment-model fit. The variations seen in the recovered FDG curve at 10 and 20 min., and in the PTSM curve at 20 min., are due to the use of fast temporal sampling at the times of injection of the other tracers.
Fig. 5
Fig. 5
Scatter plots of FDG SUVs and net-uptake parameters recovered from dual-tracer (FDG at 0 min., plus a Cu-tracer at 10 or 20 min.) versus separate single-tracer imaging with PTSM and ATSM. Excellent correlations were obtained, indicating that these broadly-characterizing imaging measures were successfully recovered from the dual-tracer signal-separation procedure.
Fig. 6
Fig. 6
Scatter plots of PTSM SUVs and the wash-in parameter K1 recovered from dual-tracer versus separate single-tracer imaging with FDG. Both PTSM injection times (10 and 20 min.) are shown.
Fig. 7
Fig. 7
Scatter plots of ATSM SUVs and net-uptake parameter Knet recovered from dual-tracer versus separate single-tracer imaging with FDG. Both ATSM injection times (10 and 20 min.) are shown.
Fig. 8
Fig. 8
Scatter plots of all triple-tracer imaging measures recovered from triple-tracer versus separate single-tracer imaging with FDG injected at 0 min., PTSM at 10 min., and ATSM at 20 min. The imaging parameter is labeled on the upper-left hand corner of each plot, and the vertical and horizontal axes represent the parameter estimates recovered from triple-tracer imaging and single-tracer imaging, respectively. All FDG measures were well recovered, indicating that imaging two additional 62Cu tracers simultaneously with FDG does not substantially corrupt the FDG information.

Similar articles

Cited by

References

    1. Huang SC, Carson RE, Hoffman EJ, Kuhl DE, Phelps ME. An investigation of a double-tracer technique for positron computerized tomography. J Nucl Med. 1982;23:816–822. - PubMed
    1. Ikoma Y, Toyama H, Uemura K, Uchiyama A. Evaluation of the reliability in kinetic analysis for dual tracer injection of FDG and flumazenil PET study. In: Seibert JA, editor. Conf Rec IEEE Nuc Sci Symp and Med Imaging Conf.; Piscataway, NJ, USA: 2001. IEEE.
    1. Koeppe RA, Ficaro EP, Raffel DM, Minoshima S, Kilbourn MR. Temporally overlapping dual-tracer PET studies. In: Carson RE, Daube-Witherspoon ME, Herscovitch P, editors. Quantitative Functional Brain Imaging With Positron Emission Tomography. San Diego, CA: Academic Press; 1998.
    1. Koeppe RA, Raffel DM, Snyder SE, Ficaro EP, Kilbourn MR, Kuhl DE. Dual-[11C]tracer single-acquisition positron emission tomography studies. J Cereb Blood Flow Metab. 2001;21:1480–1492. - PubMed
    1. Kadrmas DJ, Rust TC. Feasibility of rapid multi-tracer PET tumor imaging. IEEE Trans Nucl Sci. 2005;52:1341–1347. - PMC - PubMed

LinkOut - more resources