

Hyperbolic planforms in relation to visual edges and textures perception
- PMID: 20046839
- PMCID: PMC2798746
- DOI: 10.1371/journal.pcbi.1000625
Hyperbolic planforms in relation to visual edges and textures perception
Abstract
We propose to use bifurcation theory and pattern formation as theoretical probes for various hypotheses about the neural organization of the brain. This allows us to make predictions about the kinds of patterns that should be observed in the activity of real brains through, e.g., optical imaging, and opens the door to the design of experiments to test these hypotheses. We study the specific problem of visual edges and textures perception and suggest that these features may be represented at the population level in the visual cortex as a specific second-order tensor, the structure tensor, perhaps within a hypercolumn. We then extend the classical ring model to this case and show that its natural framework is the non-Euclidean hyperbolic geometry. This brings in the beautiful structure of its group of isometries and certain of its subgroups which have a direct interpretation in terms of the organization of the neural populations that are assumed to encode the structure tensor. By studying the bifurcations of the solutions of the structure tensor equations, the analog of the classical Wilson and Cowan equations, under the assumption of invariance with respect to the action of these subgroups, we predict the appearance of characteristic patterns. These patterns can be described by what we call hyperbolic or H-planforms that are reminiscent of Euclidean planar waves and of the planforms that were used in previous work to account for some visual hallucinations. If these patterns could be observed through brain imaging techniques they would reveal the built-in or acquired invariance of the neural organization to the action of the corresponding subgroups.
Conflict of interest statement
The authors have declared that no competing interests exist.
Figures
 and
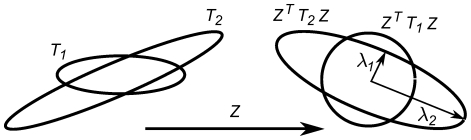
and  are represented by the elliptic blobs shown in the lefthand side of the figure. After the change of coordinates defined by the matrix
  ,
,  is represented by the unit disk and the principal axes of
  are equal to the eigenvalues
  and
and  that appear in (6), see text.

 which is used to estimate the image derivatives and some of its transformations under the action of some elements of
  (see text).
 of
of  are the real values
  and
and  such that
  . The horocycle through
  is the circle tangent to
  at
at  and going through
  .
.  is equal to the (hyperbolic) signed distance
  between the origin
  and the point
  which is equal to
  and is negative if
  is inside the circle of diameter
  and positive otherwise.
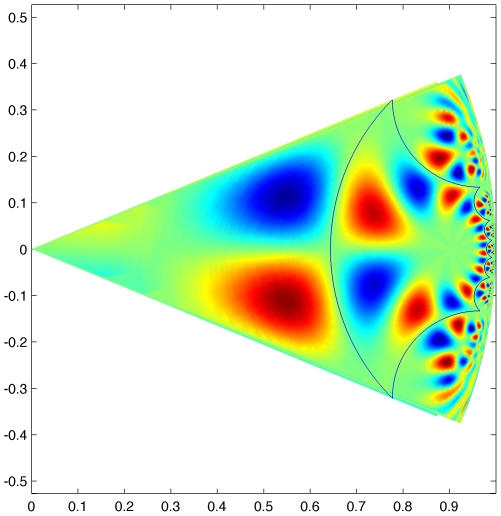
 . The color represents the value of the magnitude of
  for z varying in
  . The periodicity is to be understood in terms of the hyperbolic distance
  . The hyperbolic distance between two consecutive points of intersection of the, say yellow, circles with the horizontal axis is the same. It does not look so to our “Euclidean” eyes and the distances look shorter when these points get closer to the point
  on the right and to the point
  of
of  on the left. These points are actually at an infinite distance from the center
  of
of  .
.
 defined in equation (24) for
  H-planforms,
  , see text. We chose
  ,
,  ,
,  and
and  in equation (3.
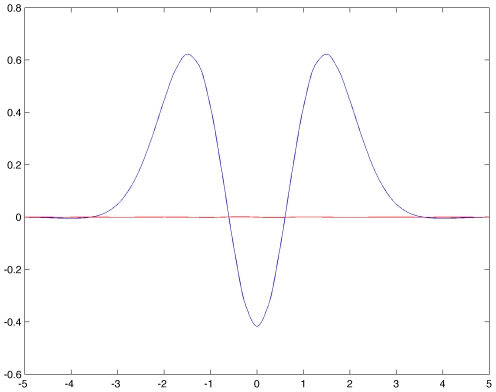
 defined in equation (24) for
  H-planforms,
  , see text. We chose
  ,
,  ,
,  and
and  and
and  in equation (3.
Similar articles
-
Geometric visual hallucinations, Euclidean symmetry and the functional architecture of striate cortex.Philos Trans R Soc Lond B Biol Sci. 2001 Mar 29;356(1407):299-330. doi: 10.1098/rstb.2000.0769. Philos Trans R Soc Lond B Biol Sci. 2001. PMID: 11316482 Free PMC article. Review.
-
A neural model of predictive recognition in form pathway of visual cortex.Biosystems. 2004 Aug-Oct;76(1-3):33-42. doi: 10.1016/j.biosystems.2004.05.004. Biosystems. 2004. PMID: 15351128
-
The Invariance Hypothesis Implies Domain-Specific Regions in Visual Cortex.PLoS Comput Biol. 2015 Oct 23;11(10):e1004390. doi: 10.1371/journal.pcbi.1004390. eCollection 2015 Oct. PLoS Comput Biol. 2015. PMID: 26496457 Free PMC article.
-
Applications of neural networks in human shape visual perception.J Opt Soc Am A Opt Image Sci Vis. 2015 Dec 1;32(12):2338-45. doi: 10.1364/JOSAA.32.002338. J Opt Soc Am A Opt Image Sci Vis. 2015. PMID: 26831387
-
The hyperbolic model for edge and texture detection in the primary visual cortex.J Math Neurosci. 2020 Jan 30;10(1):2. doi: 10.1186/s13408-020-0079-y. J Math Neurosci. 2020. PMID: 32002707 Free PMC article. Review.
Cited by
-
Orientation Maps in V1 and Non-Euclidean Geometry.J Math Neurosci. 2015 Dec;5(1):24. doi: 10.1186/s13408-015-0024-7. Epub 2015 Jun 17. J Math Neurosci. 2015. PMID: 26082007 Free PMC article.
-
How uncertainty bounds the shape index of simple cells.J Math Neurosci. 2014 Apr 17;4(1):5. doi: 10.1186/2190-8567-4-5. J Math Neurosci. 2014. PMID: 24742044 Free PMC article.
-
A neural field model for color perception unifying assimilation and contrast.PLoS Comput Biol. 2019 Jun 7;15(6):e1007050. doi: 10.1371/journal.pcbi.1007050. eCollection 2019 Jun. PLoS Comput Biol. 2019. PMID: 31173581 Free PMC article.
-
Hallucinogen persisting perception disorder in neuronal networks with adaptation.J Comput Neurosci. 2012 Feb;32(1):25-53. doi: 10.1007/s10827-011-0335-y. Epub 2011 Jun 14. J Comput Neurosci. 2012. PMID: 21671074
-
Localized states in an unbounded neural field equation with smooth firing rate function: a multi-parameter analysis.J Math Biol. 2013 May;66(6):1303-38. doi: 10.1007/s00285-012-0532-y. Epub 2012 Apr 20. J Math Biol. 2013. PMID: 22526840
References
-
- Marr D. Vision. W.H. Freeman and Co; 1982.
-
- Koenderink J, van Doorn A. Representation of local geometry in the visual system. Biological Cybernetics. 1987;55:367–375. - PubMed
-
- Florack L, Romeny BtH, Viergever M, Koenderink J. The Gaussian scale-space paradigm and the multiscale local jet. The International Journal of Computer Vision. 1996;18:61–75.
-
- Pratt W. Digital Image Processing. New York: John Wiley & Sons; 1978.
-
- Ballard D, Brown C. Computer Vision. Englewood Cliffs, New Jersey: Prentice-Hall; 1982.
Publication types
MeSH terms
LinkOut - more resources
Full Text Sources
Miscellaneous
