

Constraint-based probabilistic learning of metabolic pathways from tomato volatiles
- PMID: 20046866
- PMCID: PMC2794349
- DOI: 10.1007/s11306-009-0166-2
Constraint-based probabilistic learning of metabolic pathways from tomato volatiles
Abstract
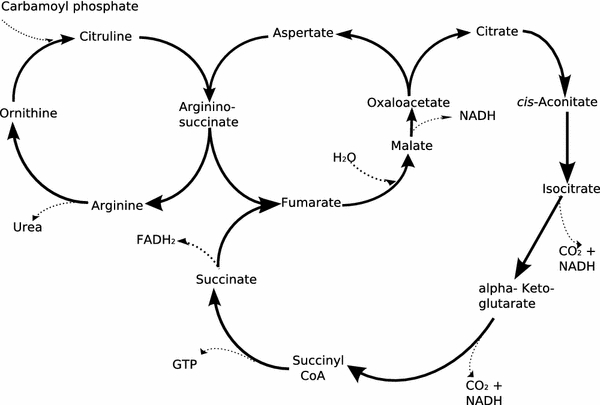
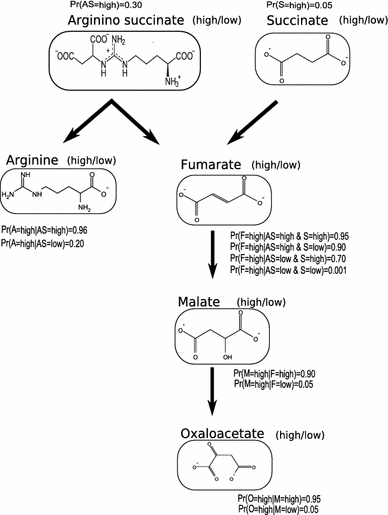
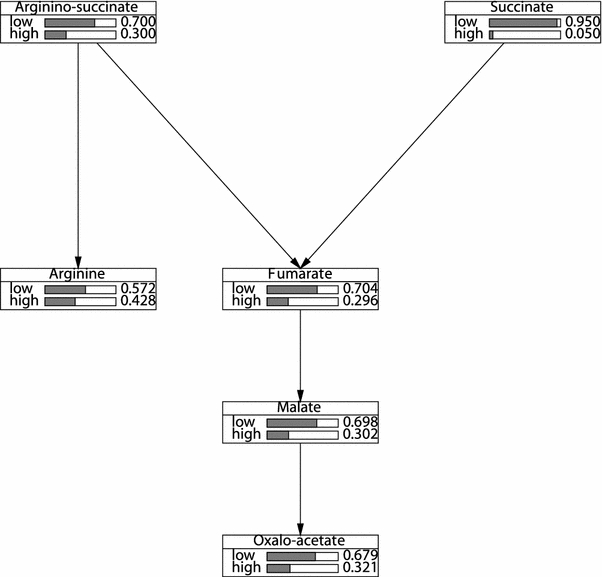
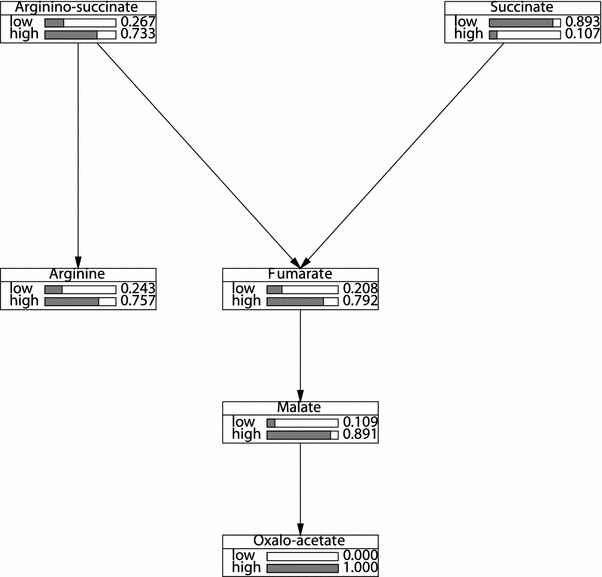
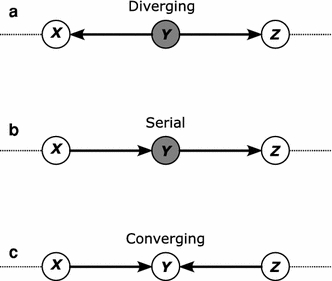
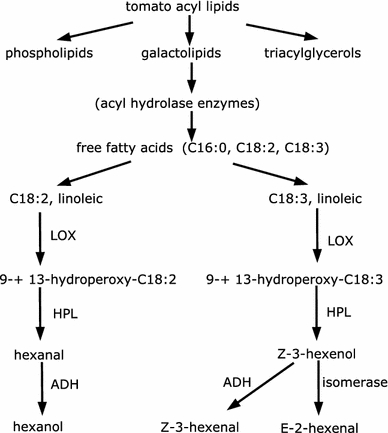
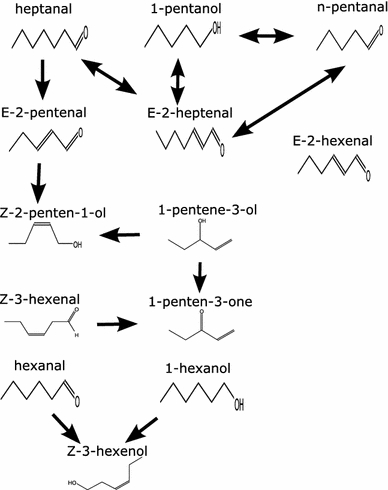
Clustering and correlation analysis techniques have become popular tools for the analysis of data produced by metabolomics experiments. The results obtained from these approaches provide an overview of the interactions between objects of interest. Often in these experiments, one is more interested in information about the nature of these relationships, e.g., cause-effect relationships, than in the actual strength of the interactions. Finding such relationships is of crucial importance as most biological processes can only be understood in this way. Bayesian networks allow representation of these cause-effect relationships among variables of interest in terms of whether and how they influence each other given that a third, possibly empty, group of variables is known. This technique also allows the incorporation of prior knowledge as established from the literature or from biologists. The representation as a directed graph of these relationship is highly intuitive and helps to understand these processes. This paper describes how constraint-based Bayesian networks can be applied to metabolomics data and can be used to uncover the important pathways which play a significant role in the ripening of fresh tomatoes. We also show here how this methods of reconstructing pathways is intuitive and performs better than classical techniques. Methods for learning Bayesian network models are powerful tools for the analysis of data of the magnitude as generated by metabolomics experiments. It allows one to model cause-effect relationships and helps in understanding the underlying processes. ELECTRONIC SUPPLEMENTARY MATERIAL: The online version of this article (doi:10.1007/s11306-009-0166-2) contains supplementary material, which is available to authorized users.
Figures
Similar articles
-
Use of reconstituted metabolic networks to assist in metabolomic data visualization and mining.Metabolomics. 2010 Jun;6(2):312-321. doi: 10.1007/s11306-009-0196-9. Epub 2010 Jan 6. Metabolomics. 2010. PMID: 20526351 Free PMC article.
-
MSClust: a tool for unsupervised mass spectra extraction of chromatography-mass spectrometry ion-wise aligned data.Metabolomics. 2012 Aug;8(4):714-718. doi: 10.1007/s11306-011-0368-2. Epub 2011 Oct 15. Metabolomics. 2012. PMID: 22833709 Free PMC article.
-
Network-based strategies in metabolomics data analysis and interpretation: from molecular networking to biological interpretation.Expert Rev Proteomics. 2020 Apr;17(4):243-255. doi: 10.1080/14789450.2020.1766975. Epub 2020 Jun 4. Expert Rev Proteomics. 2020. PMID: 32380880 Review.
-
Metabolic network discovery through reverse engineering of metabolome data.Metabolomics. 2009 Sep;5(3):318-329. doi: 10.1007/s11306-009-0156-4. Epub 2009 Feb 21. Metabolomics. 2009. PMID: 19718266 Free PMC article.
-
Temporal abstraction and temporal Bayesian networks in clinical domains: a survey.Artif Intell Med. 2014 Mar;60(3):133-49. doi: 10.1016/j.artmed.2013.12.007. Epub 2014 Jan 17. Artif Intell Med. 2014. PMID: 24529699 Review.
Cited by
-
A role for differential glycoconjugation in the emission of phenylpropanoid volatiles from tomato fruit discovered using a metabolic data fusion approach.Plant Physiol. 2010 Jan;152(1):55-70. doi: 10.1104/pp.109.146670. Epub 2009 Nov 4. Plant Physiol. 2010. PMID: 19889876 Free PMC article.
-
A new method to infer causal phenotype networks using QTL and phenotypic information.PLoS One. 2014 Aug 21;9(8):e103997. doi: 10.1371/journal.pone.0103997. eCollection 2014. PLoS One. 2014. PMID: 25144184 Free PMC article.
-
Profiling of spatial metabolite distributions in wheat leaves under normal and nitrate limiting conditions.Phytochemistry. 2015 Jul;115:99-111. doi: 10.1016/j.phytochem.2015.01.007. Epub 2015 Feb 10. Phytochemistry. 2015. PMID: 25680480 Free PMC article.
References
-
- Baldwin E, Scott J, Shewmaker C, Schuch W. Flavor trivia and tomato aroma: Biochemistry and possible mechanisms for control of important aroma components. Hort Science. 2000;35:1013–1022.
-
- Dellaert, F. (2002). The expectation maximization algorithm. Tech. rep., College of Computing, Georgia Institute of Technology.
-
- Eiceman, G., & Karpas, Z. (2005). Ion mobility spectrometry. USA: CRC Press.
-
- Elidan, G., & Friedman, N. (2003). The information bottleneck EM algorithm. In proceedings of UAI, Morgan Kaufmann (pp. 200–208).
LinkOut - more resources
Full Text Sources