

Bias, efficiency, and agreement for group-testing regression models
- PMID: 20046956
- PMCID: PMC2744319
- DOI: 10.1080/00949650701608990
Bias, efficiency, and agreement for group-testing regression models
Abstract
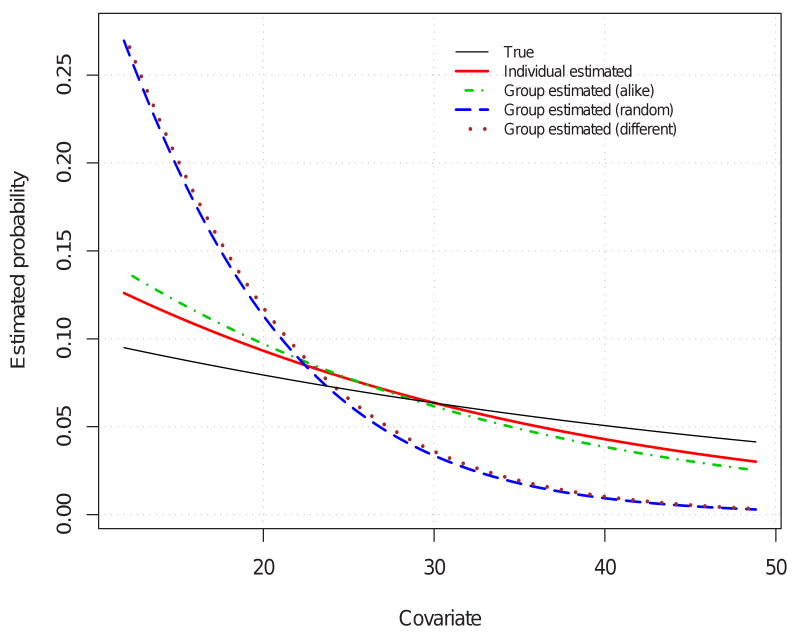
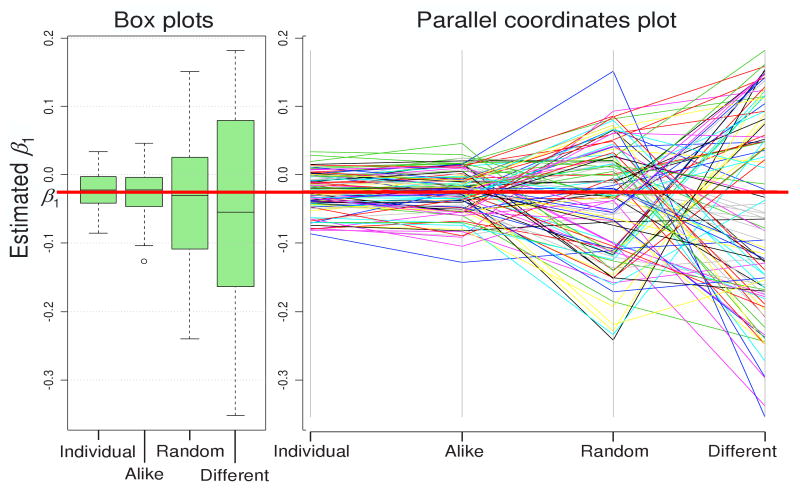
Group testing involves pooling individual items together and testing them simultaneously for a rare binary trait. Whether the goal is to estimate the prevalence of the trait or to identify those individuals that possess it, group testing can provide substantial benefits when compared to testing subjects individually. Recently, group-testing regression models have been proposed as a way to incorporate covariates when estimating trait prevalence. In this paper, we examine these models by comparing fits obtained from individual and group testing samples. Relative bias and efficiency measures are used to assess the accuracy and precision of the resulting estimates using different grouping strategies. We also investigate the agreement of individual and group-testing regression estimates for various grouping strategies and the effects of group size selection. Depending on how groups are formed, our results show that group-testing regression models can perform very well when compared to the analogous models based on individual observations. However, different grouping strategies can provide very different results in finite samples.
Figures
References
-
- Watson M. Factors affecting the amount of infection obtained by aphis transmission of the virus Hy. III. Philosophical Transactions of the Royal Society of London, Series B. 1936;226:457–489.
-
- Dorfman R. The detection of defective members of large populations. Annals of Mathematical Statistics. 1943;14:436–440.
-
- Cardoso M, Koerner K, Kubanek B. Mini-pool screening by nucleic acid testing for hepatitis B virus, hepatitis C virus, and HIV: Preliminary results. Transfusion. 1998;38:905–907. - PubMed
-
- Drosten C, Weber M, Seifried E, Roth W. Evaluation of a new PCR assay with competitive interval control sequence for blood donor screening. Transfusion. 2000;40:718–724. - PubMed
-
- Pfeiffer R, Rutter J, Gail M, Stuewing J, Gastwirth J. Efficiency of DNA pooling to estimate joint allele frequencies and measure linkage disequilibrium. Genetic Epidemiology. 22:94–102. - PubMed
Grants and funding
LinkOut - more resources
Full Text Sources